Turkish vs Immigrants from Moldova 5th Grade

COMPARE

Turkish
Race
Ancestry
AfghanAfricanAlaska NativeAlaskan AthabascanAlbanianAleutAlsatianAmericanApacheArabArapahoArgentineanArmenianAssyrian/Chaldean/SyriacAustralianAustrianBahamianBangladeshiBarbadianBasqueBelgianBelizeanBermudanBhutaneseBlackfeetBolivianBrazilianBritishBritish West IndianBulgarianBurmeseCajunCambodianCanadianCape VerdeanCarpatho RusynCelticCentral AmericanCentral American IndianCherokeeCheyenneChickasawChileanChineseChippewaChoctawColombianColvilleComancheCosta RicanCreeCreekCroatianCrowCubanCypriotCzechCzechoslovakianDanishDelawareDominicanDutchDutch West IndianEastern EuropeanEcuadorianEgyptianEnglishEstonianEthiopianEuropeanFijianFilipinoFinnishFrenchFrench American IndianFrench CanadianGermanGerman RussianGhanaianGreekGuamanian/ChamorroGuatemalanGuyaneseHaitianHmongHonduranHopiHoumaHungarianIcelanderIndian (Asian)IndonesianInupiatIranianIraqiIrishIroquoisIsraeliItalianJamaicanJapaneseJordanianKenyanKiowaKoreanLaotianLatvianLebaneseLiberianLithuanianLumbeeLuxembourgerMacedonianMalaysianMalteseMarshalleseMenomineeMexicanMexican American IndianMongolianMoroccanNative HawaiianNavajoNepaleseNew ZealanderNicaraguanNigerianNorthern EuropeanNorwegianOkinawanOsageOttawaPaiutePakistaniPalestinianPanamanianParaguayanPennsylvania GermanPeruvianPimaPolishPortuguesePotawatomiPuebloPuerto RicanPuget Sound SalishRomanianRussianSalvadoranSamoanScandinavianScotch-IrishScottishSeminoleSenegaleseSerbianShoshoneSierra LeoneanSiouxSlavicSlovakSloveneSomaliSouth AfricanSouth AmericanSouth American IndianSoviet UnionSpaniardSpanishSpanish AmericanSpanish American IndianSri LankanSubsaharan AfricanSudaneseSwedishSwissSyrianTaiwaneseThaiTlingit-HaidaTohono O'OdhamTonganTrinidadian and TobagonianTsimshianTurkishU.S. Virgin IslanderUgandanUkrainianUruguayanUteVenezuelanVietnameseWelshWest IndianYakamaYaquiYugoslavianYumanYup'ikZimbabwean
Immigration
NonimmigrantsImmigrantsAfghanistanAfricaAlbaniaArgentinaArmeniaAsiaAustraliaAustriaBahamasBangladeshBarbadosBelarusBelgiumBelizeBoliviaBosnia and HerzegovinaBrazilBulgariaBurma/MyanmarCabo VerdeCambodiaCameroonCanadaCaribbeanCentral AmericaChileChinaColombiaCongoCosta RicaCroatiaCubaCzechoslovakiaDenmarkDominicaDominican RepublicEastern AfricaEastern AsiaEastern EuropeEcuadorEgyptEl SalvadorEnglandEritreaEthiopiaEuropeFijiFranceGermanyGhanaGreeceGrenadaGuatemalaGuyanaHaitiHondurasHong KongHungaryIndiaIndonesiaIranIraqIrelandIsraelItalyJamaicaJapanJordanKazakhstanKenyaKoreaKuwaitLaosLatin AmericaLatviaLebanonLiberiaLithuaniaMalaysiaMexicoMicronesiaMiddle AfricaMoroccoNepalNetherlandsNicaraguaNigeriaNorth AmericaNorth MacedoniaNorthern AfricaNorthern EuropeNorwayOceaniaPakistanPanamaPeruPhilippinesPolandPortugalRomaniaRussiaSaudi ArabiaScotlandSenegalSerbiaSierra LeoneSingaporeSomaliaSouth AfricaSouth AmericaSouth Central AsiaSouth Eastern AsiaSouthern EuropeSpainSri LankaSt. Vincent and the GrenadinesSudanSwedenSwitzerlandSyriaTaiwanThailandTrinidad and TobagoTurkeyUgandaUkraineUruguayUzbekistanVenezuelaVietnamWest IndiesWestern AfricaWestern AsiaWestern EuropeYemenZaireZimbabweAzores
Immigrants from Moldova
Race
Ancestry
AfghanAfricanAlaska NativeAlaskan AthabascanAlbanianAleutAlsatianAmericanApacheArabArapahoArgentineanArmenianAssyrian/Chaldean/SyriacAustralianAustrianBahamianBangladeshiBarbadianBasqueBelgianBelizeanBermudanBhutaneseBlackfeetBolivianBrazilianBritishBritish West IndianBulgarianBurmeseCajunCambodianCanadianCape VerdeanCarpatho RusynCelticCentral AmericanCentral American IndianCherokeeCheyenneChickasawChileanChineseChippewaChoctawColombianColvilleComancheCosta RicanCreeCreekCroatianCrowCubanCypriotCzechCzechoslovakianDanishDelawareDominicanDutchDutch West IndianEastern EuropeanEcuadorianEgyptianEnglishEstonianEthiopianEuropeanFijianFilipinoFinnishFrenchFrench American IndianFrench CanadianGermanGerman RussianGhanaianGreekGuamanian/ChamorroGuatemalanGuyaneseHaitianHmongHonduranHopiHoumaHungarianIcelanderIndian (Asian)IndonesianInupiatIranianIraqiIrishIroquoisIsraeliItalianJamaicanJapaneseJordanianKenyanKiowaKoreanLaotianLatvianLebaneseLiberianLithuanianLumbeeLuxembourgerMacedonianMalaysianMalteseMarshalleseMenomineeMexicanMexican American IndianMongolianMoroccanNative HawaiianNavajoNepaleseNew ZealanderNicaraguanNigerianNorthern EuropeanNorwegianOkinawanOsageOttawaPaiutePakistaniPalestinianPanamanianParaguayanPennsylvania GermanPeruvianPimaPolishPortuguesePotawatomiPuebloPuerto RicanPuget Sound SalishRomanianRussianSalvadoranSamoanScandinavianScotch-IrishScottishSeminoleSenegaleseSerbianShoshoneSierra LeoneanSiouxSlavicSlovakSloveneSomaliSouth AfricanSouth AmericanSouth American IndianSoviet UnionSpaniardSpanishSpanish AmericanSpanish American IndianSri LankanSubsaharan AfricanSudaneseSwedishSwissSyrianTaiwaneseThaiTlingit-HaidaTohono O'OdhamTonganTrinidadian and TobagonianTsimshianU.S. Virgin IslanderUgandanUkrainianUruguayanUteVenezuelanVietnameseWelshWest IndianYakamaYaquiYugoslavianYumanYup'ikZimbabwean
Immigration
NonimmigrantsImmigrantsAfghanistanAfricaAlbaniaArgentinaArmeniaAsiaAustraliaAustriaBahamasBangladeshBarbadosBelarusBelgiumBelizeBoliviaBosnia and HerzegovinaBrazilBulgariaBurma/MyanmarCabo VerdeCambodiaCameroonCanadaCaribbeanCentral AmericaChileChinaColombiaCongoCosta RicaCroatiaCubaCzechoslovakiaDenmarkDominicaDominican RepublicEastern AfricaEastern AsiaEastern EuropeEcuadorEgyptEl SalvadorEnglandEritreaEthiopiaEuropeFijiFranceGermanyGhanaGreeceGrenadaGuatemalaGuyanaHaitiHondurasHong KongHungaryIndiaIndonesiaIranIraqIrelandIsraelItalyJamaicaJapanJordanKazakhstanKenyaKoreaKuwaitLaosLatin AmericaLatviaLebanonLiberiaLithuaniaMalaysiaMexicoMicronesiaMiddle AfricaMoldovaMoroccoNepalNetherlandsNicaraguaNigeriaNorth AmericaNorth MacedoniaNorthern AfricaNorthern EuropeNorwayOceaniaPakistanPanamaPeruPhilippinesPolandPortugalRomaniaRussiaSaudi ArabiaScotlandSenegalSerbiaSierra LeoneSingaporeSomaliaSouth AfricaSouth AmericaSouth Central AsiaSouth Eastern AsiaSouthern EuropeSpainSri LankaSt. Vincent and the GrenadinesSudanSwedenSwitzerlandSyriaTaiwanThailandTrinidad and TobagoTurkeyUgandaUkraineUruguayUzbekistanVenezuelaVietnamWest IndiesWestern AfricaWestern AsiaWestern EuropeYemenZaireZimbabweAzores
5th Grade
Income
Poverty
Unemployment
Labor Participation
Family Structure
Vehicle Availability
Education Level
Disability

5th Grade Comparison

Turks

Immigrants from Moldova

Exceptional
Excellent
97.7%
5TH GRADE
98.3/ 100
METRIC RATING
99th/ 347
METRIC RANK
97.5%
5TH GRADE
87.5/ 100
METRIC RATING
136th/ 347
METRIC RANK

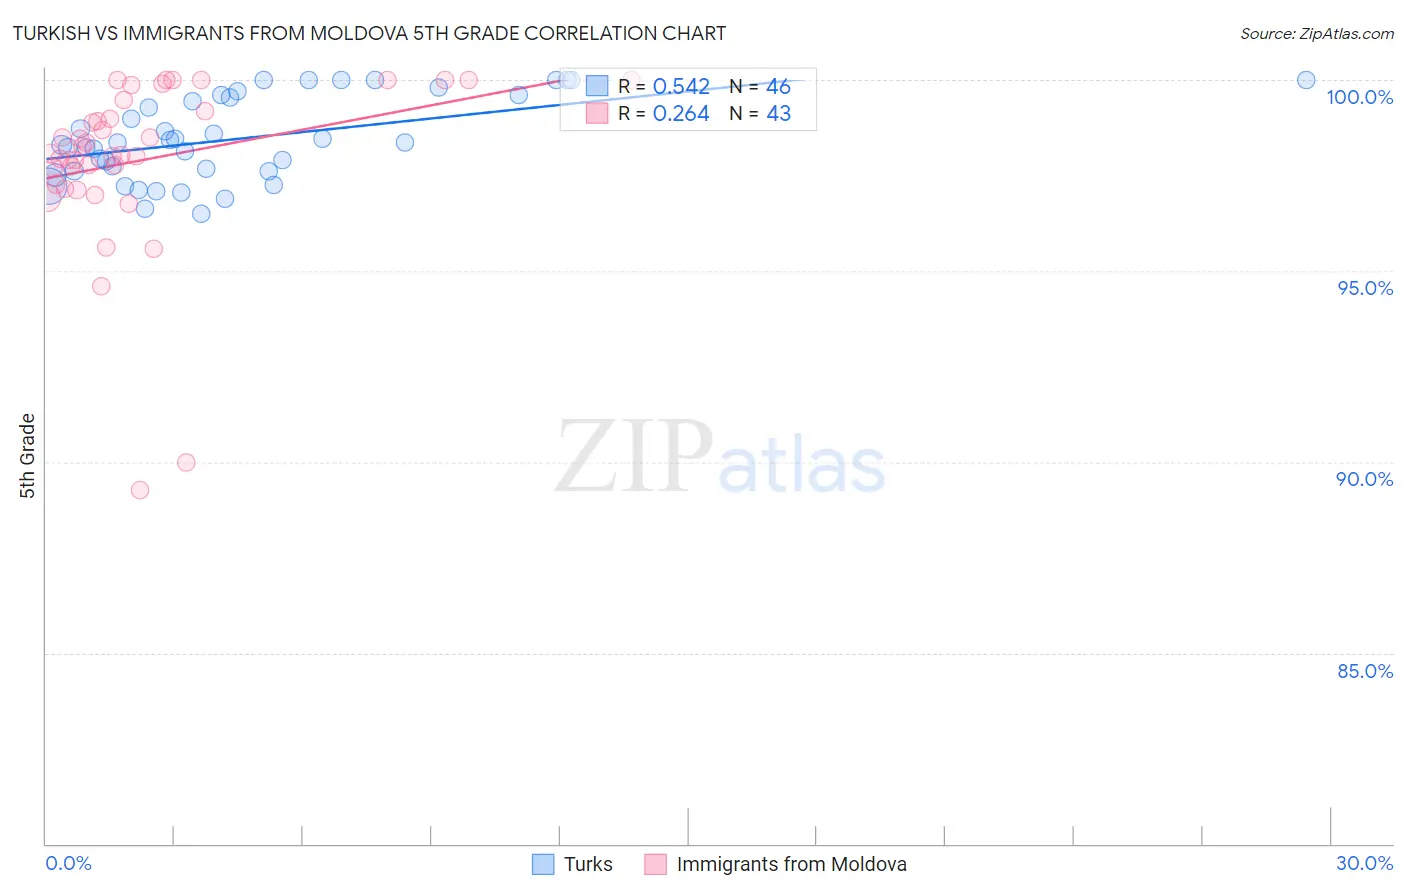
Turkish vs Immigrants from Moldova 5th Grade Correlation Chart

The statistical analysis conducted on geographies consisting of 271,858,657 people shows a substantial positive correlation between the proportion of Turks and percentage of population with at least 5th grade education in the United States with a correlation coefficient (R) of 0.542 and weighted average of 97.7%. Similarly, the statistical analysis conducted on geographies consisting of 124,398,501 people shows a weak positive correlation between the proportion of Immigrants from Moldova and percentage of population with at least 5th grade education in the United States with a correlation coefficient (R) of 0.264 and weighted average of 97.5%, a difference of 0.22%.
Turkish vs Immigrants from Moldova 5th Grade

5th Grade Correlation Summary

MeasurementTurkishImmigrants from Moldova
Minimum96.5%89.3%
Maximum100.0%100.0%
Range3.5%10.7%
Mean98.5%97.9%
Median98.4%98.1%
Interquartile 25% (IQ1)97.6%97.3%
Interquartile 75% (IQ3)99.6%99.5%
Interquartile Range (IQR)2.0%2.2%
Standard Deviation (Sample)1.1%2.3%
Standard Deviation (Population)1.1%2.2%

Similar Demographics by 5th Grade

Demographics Similar to Turks by 5th Grade

In terms of 5th grade, the demographic groups most similar to Turks are Yugoslavian (97.7%, a difference of 0.0%), Puget Sound Salish (97.7%, a difference of 0.0%), South African (97.7%, a difference of 0.0%), Cree (97.7%, a difference of 0.010%), and Delaware (97.8%, a difference of 0.020%).
DemographicsRating | Rank5th Grade
Immigrants | Sweden
98.7
/100
|
#92
Exceptional
97.8%
Delaware
98.6
/100
|
#93
Exceptional
97.8%
Immigrants | Denmark
98.6
/100
|
#94
Exceptional
97.8%
Romanians
98.6
/100
|
#95
Exceptional
97.8%
Immigrants | Germany
98.5
/100
|
#96
Exceptional
97.8%
Cree
98.4
/100
|
#97
Exceptional
97.7%
Yugoslavians
98.3
/100
|
#98
Exceptional
97.7%
Turks
98.3
/100
|
#99
Exceptional
97.7%
Puget Sound Salish
98.3
/100
|
#100
Exceptional
97.7%
South Africans
98.3
/100
|
#101
Exceptional
97.7%
Choctaw
98.0
/100
|
#102
Exceptional
97.7%
Cheyenne
97.9
/100
|
#103
Exceptional
97.7%
German Russians
97.8
/100
|
#104
Exceptional
97.7%
Bhutanese
97.6
/100
|
#105
Exceptional
97.7%
Immigrants | Czechoslovakia
97.5
/100
|
#106
Exceptional
97.7%

Demographics Similar to Immigrants from Moldova by 5th Grade

In terms of 5th grade, the demographic groups most similar to Immigrants from Moldova are Filipino (97.5%, a difference of 0.010%), Blackfeet (97.5%, a difference of 0.010%), Immigrants from Turkey (97.5%, a difference of 0.010%), Burmese (97.5%, a difference of 0.010%), and Palestinian (97.5%, a difference of 0.020%).
DemographicsRating | Rank5th Grade
Immigrants | Europe
91.9
/100
|
#129
Exceptional
97.6%
Immigrants | Romania
91.6
/100
|
#130
Exceptional
97.6%
Pima
91.2
/100
|
#131
Exceptional
97.6%
Immigrants | Kuwait
90.4
/100
|
#132
Exceptional
97.6%
Cambodians
90.2
/100
|
#133
Exceptional
97.6%
Immigrants | Hungary
90.1
/100
|
#134
Exceptional
97.6%
Palestinians
89.3
/100
|
#135
Excellent
97.5%
Immigrants | Moldova
87.5
/100
|
#136
Excellent
97.5%
Filipinos
86.8
/100
|
#137
Excellent
97.5%
Blackfeet
86.8
/100
|
#138
Excellent
97.5%
Immigrants | Turkey
86.7
/100
|
#139
Excellent
97.5%
Burmese
86.1
/100
|
#140
Excellent
97.5%
Seminole
85.8
/100
|
#141
Excellent
97.5%
Israelis
85.5
/100
|
#142
Excellent
97.5%
Immigrants | North Macedonia
85.4
/100
|
#143
Excellent
97.5%