Turkish vs Central American Indian 11th Grade
COMPARE
Turkish
Central American Indian
11th Grade
11th Grade Comparison
Turks
Central American Indians
94.0%
11TH GRADE
99.9/ 100
METRIC RATING
51st/ 347
METRIC RANK
88.2%
11TH GRADE
0.0/ 100
METRIC RATING
324th/ 347
METRIC RANK
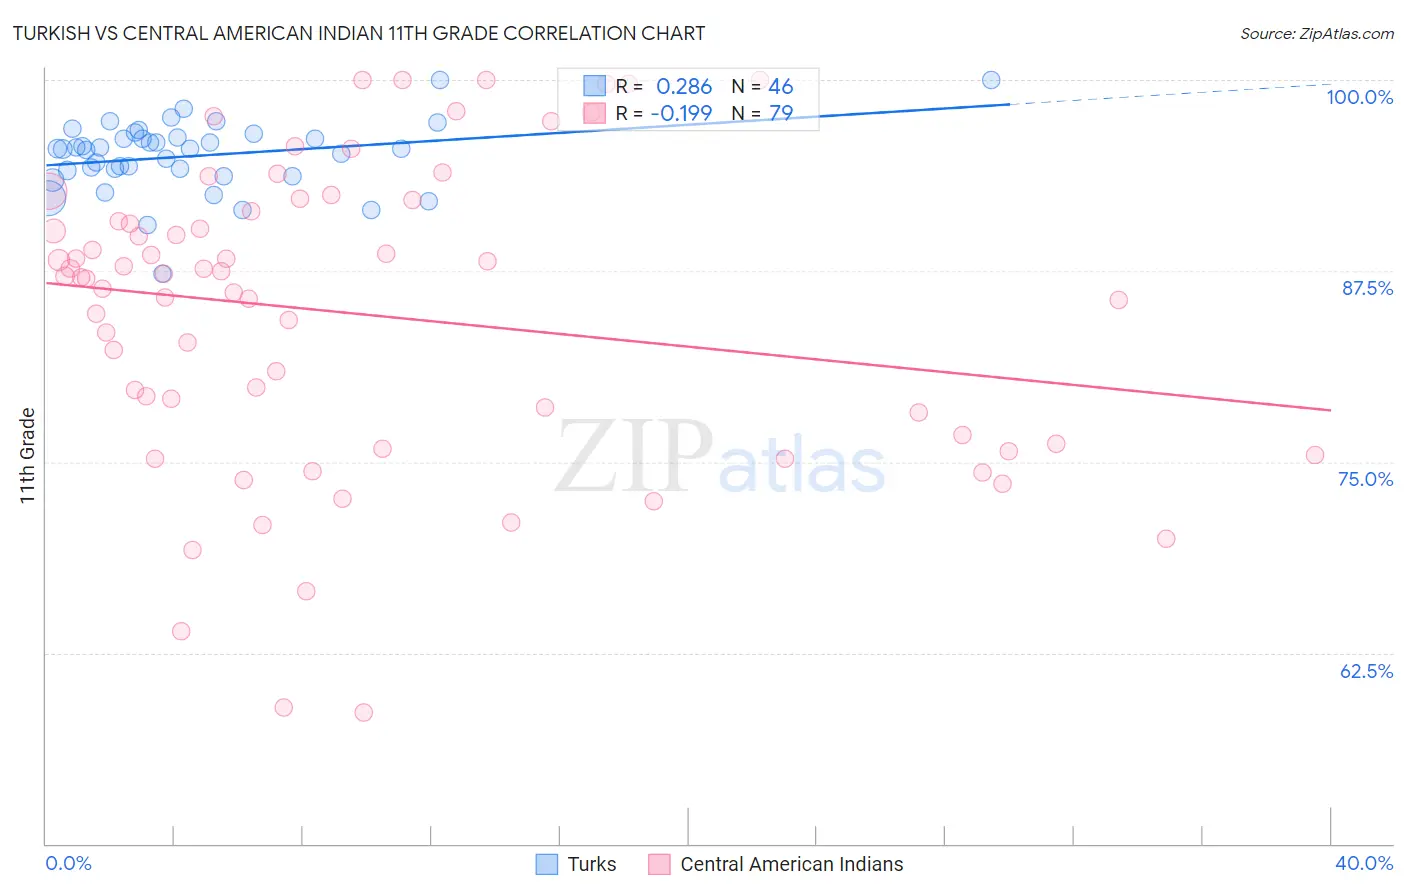
Turkish vs Central American Indian 11th Grade Correlation Chart
The statistical analysis conducted on geographies consisting of 271,864,104 people shows a weak positive correlation between the proportion of Turks and percentage of population with at least 11th grade education in the United States with a correlation coefficient (R) of 0.286 and weighted average of 94.0%. Similarly, the statistical analysis conducted on geographies consisting of 326,142,643 people shows a poor negative correlation between the proportion of Central American Indians and percentage of population with at least 11th grade education in the United States with a correlation coefficient (R) of -0.199 and weighted average of 88.2%, a difference of 6.6%.
11th Grade Correlation Summary
| Measurement | Turkish | Central American Indian |
| Minimum | 87.4% | 58.6% |
| Maximum | 100.0% | 100.0% |
| Range | 12.6% | 41.4% |
| Mean | 95.0% | 84.6% |
| Median | 95.5% | 87.1% |
| Interquartile 25% (IQ1) | 94.1% | 76.2% |
| Interquartile 75% (IQ3) | 96.2% | 91.4% |
| Interquartile Range (IQR) | 2.1% | 15.2% |
| Standard Deviation (Sample) | 2.3% | 9.9% |
| Standard Deviation (Population) | 2.3% | 9.8% |
Similar Demographics by 11th Grade
Demographics Similar to Turks by 11th Grade
In terms of 11th grade, the demographic groups most similar to Turks are Immigrants from Canada (94.0%, a difference of 0.010%), Immigrants from Australia (94.0%, a difference of 0.020%), Filipino (94.1%, a difference of 0.030%), Macedonian (94.1%, a difference of 0.030%), and Slavic (94.1%, a difference of 0.030%).
| Demographics | Rating | Rank | 11th Grade |
| Immigrants | Ireland | 99.9 /100 | #44 | Exceptional 94.1% |
| Australians | 99.9 /100 | #45 | Exceptional 94.1% |
| Serbians | 99.9 /100 | #46 | Exceptional 94.1% |
| Filipinos | 99.9 /100 | #47 | Exceptional 94.1% |
| Macedonians | 99.9 /100 | #48 | Exceptional 94.1% |
| Slavs | 99.9 /100 | #49 | Exceptional 94.1% |
| French | 99.9 /100 | #50 | Exceptional 94.1% |
| Turks | 99.9 /100 | #51 | Exceptional 94.0% |
| Immigrants | Canada | 99.9 /100 | #52 | Exceptional 94.0% |
| Immigrants | Australia | 99.9 /100 | #53 | Exceptional 94.0% |
| Immigrants | North America | 99.9 /100 | #54 | Exceptional 94.0% |
| Czechoslovakians | 99.9 /100 | #55 | Exceptional 94.0% |
| French Canadians | 99.9 /100 | #56 | Exceptional 94.0% |
| New Zealanders | 99.9 /100 | #57 | Exceptional 94.0% |
| Iranians | 99.9 /100 | #58 | Exceptional 94.0% |
Demographics Similar to Central American Indians by 11th Grade
In terms of 11th grade, the demographic groups most similar to Central American Indians are Pima (88.3%, a difference of 0.040%), Puerto Rican (88.4%, a difference of 0.12%), Immigrants from Nicaragua (88.1%, a difference of 0.13%), Immigrants from Belize (88.7%, a difference of 0.51%), and Immigrants from Armenia (88.8%, a difference of 0.60%).
| Demographics | Rating | Rank | 11th Grade |
| Lumbee | 0.0 /100 | #317 | Tragic 88.9% |
| Nicaraguans | 0.0 /100 | #318 | Tragic 88.9% |
| Belizeans | 0.0 /100 | #319 | Tragic 88.8% |
| Immigrants | Armenia | 0.0 /100 | #320 | Tragic 88.8% |
| Immigrants | Belize | 0.0 /100 | #321 | Tragic 88.7% |
| Puerto Ricans | 0.0 /100 | #322 | Tragic 88.4% |
| Pima | 0.0 /100 | #323 | Tragic 88.3% |
| Central American Indians | 0.0 /100 | #324 | Tragic 88.2% |
| Immigrants | Nicaragua | 0.0 /100 | #325 | Tragic 88.1% |
| Dominicans | 0.0 /100 | #326 | Tragic 87.7% |
| Immigrants | Cabo Verde | 0.0 /100 | #327 | Tragic 87.6% |
| Tohono O'odham | 0.0 /100 | #328 | Tragic 87.6% |
| Mexican American Indians | 0.0 /100 | #329 | Tragic 87.5% |
| Hondurans | 0.0 /100 | #330 | Tragic 87.4% |
| Hispanics or Latinos | 0.0 /100 | #331 | Tragic 87.3% |