Tsimshian vs Sierra Leonean 12th Grade, No Diploma

COMPARE

Tsimshian
Race
Ancestry
AfghanAfricanAlaska NativeAlaskan AthabascanAlbanianAleutAlsatianAmericanApacheArabArapahoArgentineanArmenianAssyrian/Chaldean/SyriacAustralianAustrianBahamianBangladeshiBarbadianBasqueBelgianBelizeanBermudanBhutaneseBlackfeetBolivianBrazilianBritishBritish West IndianBulgarianBurmeseCajunCambodianCanadianCape VerdeanCarpatho RusynCelticCentral AmericanCentral American IndianCherokeeCheyenneChickasawChileanChineseChippewaChoctawColombianColvilleComancheCosta RicanCreeCreekCroatianCrowCubanCypriotCzechCzechoslovakianDanishDelawareDominicanDutchDutch West IndianEastern EuropeanEcuadorianEgyptianEnglishEstonianEthiopianEuropeanFijianFilipinoFinnishFrenchFrench American IndianFrench CanadianGermanGerman RussianGhanaianGreekGuamanian/ChamorroGuatemalanGuyaneseHaitianHmongHonduranHopiHoumaHungarianIcelanderIndian (Asian)IndonesianInupiatIranianIraqiIrishIroquoisIsraeliItalianJamaicanJapaneseJordanianKenyanKiowaKoreanLaotianLatvianLebaneseLiberianLithuanianLumbeeLuxembourgerMacedonianMalaysianMalteseMarshalleseMenomineeMexicanMexican American IndianMongolianMoroccanNative HawaiianNavajoNepaleseNew ZealanderNicaraguanNigerianNorthern EuropeanNorwegianOkinawanOsageOttawaPaiutePakistaniPalestinianPanamanianParaguayanPennsylvania GermanPeruvianPimaPolishPortuguesePotawatomiPuebloPuerto RicanPuget Sound SalishRomanianRussianSalvadoranSamoanScandinavianScotch-IrishScottishSeminoleSenegaleseSerbianShoshoneSiouxSlavicSlovakSloveneSomaliSouth AfricanSouth AmericanSouth American IndianSoviet UnionSpaniardSpanishSpanish AmericanSpanish American IndianSri LankanSubsaharan AfricanSudaneseSwedishSwissSyrianTaiwaneseThaiTlingit-HaidaTohono O'OdhamTonganTrinidadian and TobagonianTsimshianTurkishU.S. Virgin IslanderUgandanUkrainianUruguayanUteVenezuelanVietnameseWelshWest IndianYakamaYaquiYugoslavianYumanYup'ikZimbabwean
Immigration
NonimmigrantsImmigrantsAfghanistanAfricaAlbaniaArgentinaArmeniaAsiaAustraliaAustriaBahamasBangladeshBarbadosBelarusBelgiumBelizeBoliviaBosnia and HerzegovinaBrazilBulgariaBurma/MyanmarCabo VerdeCambodiaCameroonCanadaCaribbeanCentral AmericaChileChinaColombiaCongoCosta RicaCroatiaCubaCzechoslovakiaDenmarkDominicaDominican RepublicEastern AfricaEastern AsiaEastern EuropeEcuadorEgyptEl SalvadorEnglandEritreaEthiopiaEuropeFijiFranceGermanyGhanaGreeceGrenadaGuatemalaGuyanaHaitiHondurasHong KongHungaryIndiaIndonesiaIranIraqIrelandIsraelItalyJamaicaJapanJordanKazakhstanKenyaKoreaKuwaitLaosLatin AmericaLatviaLebanonLiberiaLithuaniaMalaysiaMexicoMicronesiaMiddle AfricaMoldovaMoroccoNepalNetherlandsNicaraguaNigeriaNorth AmericaNorth MacedoniaNorthern AfricaNorthern EuropeNorwayOceaniaPakistanPanamaPeruPhilippinesPolandPortugalRomaniaRussiaSaudi ArabiaScotlandSenegalSerbiaSierra LeoneSingaporeSomaliaSouth AfricaSouth AmericaSouth Central AsiaSouth Eastern AsiaSouthern EuropeSpainSri LankaSt. Vincent and the GrenadinesSudanSwedenSwitzerlandSyriaTaiwanThailandTrinidad and TobagoTurkeyUgandaUkraineUruguayUzbekistanVenezuelaVietnamWest IndiesWestern AfricaWestern AsiaWestern EuropeYemenZaireZimbabweAzores
Sierra Leonean
Race
Ancestry
AfghanAfricanAlaska NativeAlaskan AthabascanAlbanianAleutAlsatianAmericanApacheArabArapahoArgentineanArmenianAssyrian/Chaldean/SyriacAustralianAustrianBahamianBangladeshiBarbadianBasqueBelgianBelizeanBermudanBhutaneseBlackfeetBolivianBrazilianBritishBritish West IndianBulgarianBurmeseCajunCambodianCanadianCape VerdeanCarpatho RusynCelticCentral AmericanCentral American IndianCherokeeCheyenneChickasawChileanChineseChippewaChoctawColombianColvilleComancheCosta RicanCreeCreekCroatianCrowCubanCypriotCzechCzechoslovakianDanishDelawareDominicanDutchDutch West IndianEastern EuropeanEcuadorianEgyptianEnglishEstonianEthiopianEuropeanFijianFilipinoFinnishFrenchFrench American IndianFrench CanadianGermanGerman RussianGhanaianGreekGuamanian/ChamorroGuatemalanGuyaneseHaitianHmongHonduranHopiHoumaHungarianIcelanderIndian (Asian)IndonesianInupiatIranianIraqiIrishIroquoisIsraeliItalianJamaicanJapaneseJordanianKenyanKiowaKoreanLaotianLatvianLebaneseLiberianLithuanianLumbeeLuxembourgerMacedonianMalaysianMalteseMarshalleseMenomineeMexicanMexican American IndianMongolianMoroccanNative HawaiianNavajoNepaleseNew ZealanderNicaraguanNigerianNorthern EuropeanNorwegianOkinawanOsageOttawaPaiutePakistaniPalestinianPanamanianParaguayanPennsylvania GermanPeruvianPimaPolishPortuguesePotawatomiPuebloPuerto RicanPuget Sound SalishRomanianRussianSalvadoranSamoanScandinavianScotch-IrishScottishSeminoleSenegaleseSerbianShoshoneSierra LeoneanSiouxSlavicSlovakSloveneSomaliSouth AfricanSouth AmericanSouth American IndianSoviet UnionSpaniardSpanishSpanish AmericanSpanish American IndianSri LankanSubsaharan AfricanSudaneseSwedishSwissSyrianTaiwaneseThaiTlingit-HaidaTohono O'OdhamTonganTrinidadian and TobagonianTurkishU.S. Virgin IslanderUgandanUkrainianUruguayanUteVenezuelanVietnameseWelshWest IndianYakamaYaquiYugoslavianYumanYup'ikZimbabwean
Immigration
NonimmigrantsImmigrantsAfghanistanAfricaAlbaniaArgentinaArmeniaAsiaAustraliaAustriaBahamasBangladeshBarbadosBelarusBelgiumBelizeBoliviaBosnia and HerzegovinaBrazilBulgariaBurma/MyanmarCabo VerdeCambodiaCameroonCanadaCaribbeanCentral AmericaChileChinaColombiaCongoCosta RicaCroatiaCubaCzechoslovakiaDenmarkDominicaDominican RepublicEastern AfricaEastern AsiaEastern EuropeEcuadorEgyptEl SalvadorEnglandEritreaEthiopiaEuropeFijiFranceGermanyGhanaGreeceGrenadaGuatemalaGuyanaHaitiHondurasHong KongHungaryIndiaIndonesiaIranIraqIrelandIsraelItalyJamaicaJapanJordanKazakhstanKenyaKoreaKuwaitLaosLatin AmericaLatviaLebanonLiberiaLithuaniaMalaysiaMexicoMicronesiaMiddle AfricaMoldovaMoroccoNepalNetherlandsNicaraguaNigeriaNorth AmericaNorth MacedoniaNorthern AfricaNorthern EuropeNorwayOceaniaPakistanPanamaPeruPhilippinesPolandPortugalRomaniaRussiaSaudi ArabiaScotlandSenegalSerbiaSierra LeoneSingaporeSomaliaSouth AfricaSouth AmericaSouth Central AsiaSouth Eastern AsiaSouthern EuropeSpainSri LankaSt. Vincent and the GrenadinesSudanSwedenSwitzerlandSyriaTaiwanThailandTrinidad and TobagoTurkeyUgandaUkraineUruguayUzbekistanVenezuelaVietnamWest IndiesWestern AfricaWestern AsiaWestern EuropeYemenZaireZimbabweAzores
12th Grade, No Diploma
Income
Poverty
Unemployment
Labor Participation
Family Structure
Vehicle Availability
Education Level
Disability

12th Grade, No Diploma Comparison

Tsimshian

Sierra Leoneans

Exceptional
Average
92.9%
12TH GRADE, NO DIPLOMA
99.8/ 100
METRIC RATING
50th/ 347
METRIC RANK
91.1%
12TH GRADE, NO DIPLOMA
47.7/ 100
METRIC RATING
177th/ 347
METRIC RANK

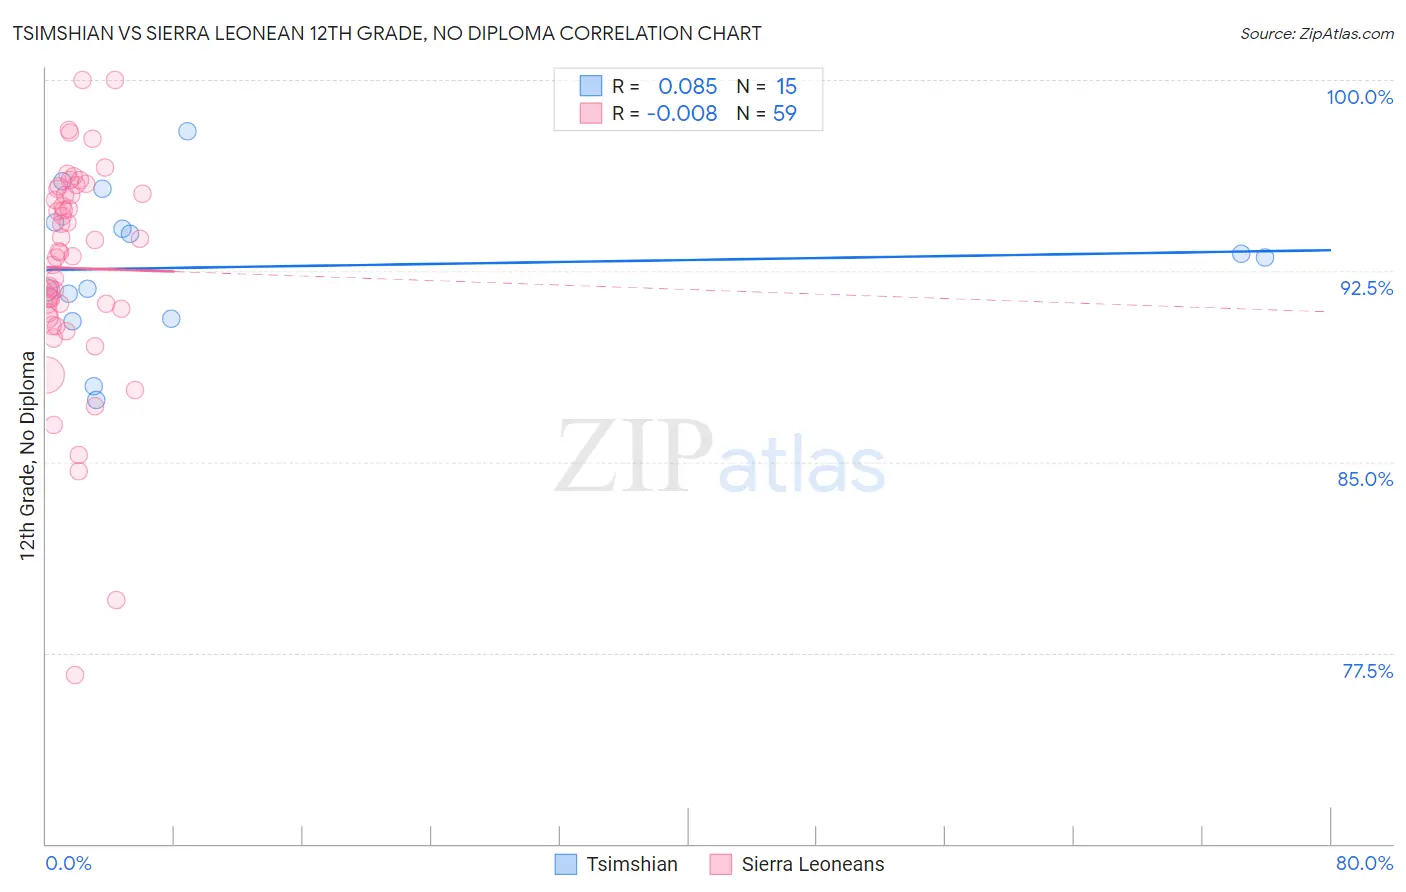
Tsimshian vs Sierra Leonean 12th Grade, No Diploma Correlation Chart

The statistical analysis conducted on geographies consisting of 15,626,544 people shows a slight positive correlation between the proportion of Tsimshian and percentage of population with at least 12th grade (no diploma) education in the United States with a correlation coefficient (R) of 0.085 and weighted average of 92.9%. Similarly, the statistical analysis conducted on geographies consisting of 83,363,012 people shows no correlation between the proportion of Sierra Leoneans and percentage of population with at least 12th grade (no diploma) education in the United States with a correlation coefficient (R) of -0.008 and weighted average of 91.1%, a difference of 1.9%.
Tsimshian vs Sierra Leonean 12th Grade, No Diploma

12th Grade, No Diploma Correlation Summary

MeasurementTsimshianSierra Leonean
Minimum87.4%76.6%
Maximum98.0%100.0%
Range10.6%23.4%
Mean92.7%92.6%
Median93.0%93.2%
Interquartile 25% (IQ1)90.6%90.9%
Interquartile 75% (IQ3)94.4%95.5%
Interquartile Range (IQR)3.8%4.7%
Standard Deviation (Sample)2.9%4.3%
Standard Deviation (Population)2.8%4.3%

Similar Demographics by 12th Grade, No Diploma

Demographics Similar to Tsimshian by 12th Grade, No Diploma

In terms of 12th grade, no diploma, the demographic groups most similar to Tsimshian are Immigrants from Belgium (92.9%, a difference of 0.0%), Macedonian (92.9%, a difference of 0.010%), Immigrants from Sweden (92.8%, a difference of 0.010%), Australian (92.9%, a difference of 0.020%), and Belgian (92.9%, a difference of 0.030%).
DemographicsRating | Rank12th Grade, No Diploma
Northern Europeans
99.8
/100
|
#43
Exceptional
92.9%
Dutch
99.8
/100
|
#44
Exceptional
92.9%
Greeks
99.8
/100
|
#45
Exceptional
92.9%
British
99.8
/100
|
#46
Exceptional
92.9%
Belgians
99.8
/100
|
#47
Exceptional
92.9%
Australians
99.8
/100
|
#48
Exceptional
92.9%
Macedonians
99.8
/100
|
#49
Exceptional
92.9%
Tsimshian
99.8
/100
|
#50
Exceptional
92.9%
Immigrants | Belgium
99.8
/100
|
#51
Exceptional
92.9%
Immigrants | Sweden
99.8
/100
|
#52
Exceptional
92.8%
Serbians
99.7
/100
|
#53
Exceptional
92.8%
Hungarians
99.7
/100
|
#54
Exceptional
92.8%
Welsh
99.7
/100
|
#55
Exceptional
92.8%
New Zealanders
99.7
/100
|
#56
Exceptional
92.8%
Immigrants | Canada
99.7
/100
|
#57
Exceptional
92.8%

Demographics Similar to Sierra Leoneans by 12th Grade, No Diploma

In terms of 12th grade, no diploma, the demographic groups most similar to Sierra Leoneans are Iroquois (91.1%, a difference of 0.010%), Immigrants from Western Asia (91.2%, a difference of 0.020%), Bolivian (91.2%, a difference of 0.030%), Immigrants from Nepal (91.2%, a difference of 0.030%), and Bermudan (91.2%, a difference of 0.040%).
DemographicsRating | Rank12th Grade, No Diploma
Delaware
52.8
/100
|
#170
Average
91.2%
Immigrants | Morocco
51.4
/100
|
#171
Average
91.2%
Bermudans
50.8
/100
|
#172
Average
91.2%
Bolivians
50.4
/100
|
#173
Average
91.2%
Immigrants | Nepal
50.0
/100
|
#174
Average
91.2%
Immigrants | Western Asia
49.0
/100
|
#175
Average
91.2%
Iroquois
48.5
/100
|
#176
Average
91.1%
Sierra Leoneans
47.7
/100
|
#177
Average
91.1%
Spanish
43.7
/100
|
#178
Average
91.1%
Immigrants | Chile
43.3
/100
|
#179
Average
91.1%
Immigrants | Syria
40.3
/100
|
#180
Average
91.1%
Guamanians/Chamorros
39.5
/100
|
#181
Fair
91.0%
Immigrants | Nonimmigrants
38.8
/100
|
#182
Fair
91.0%
Osage
38.3
/100
|
#183
Fair
91.0%
Spaniards
36.2
/100
|
#184
Fair
91.0%