Trinidadian and Tobagonian vs Ecuadorian 5th Grade
COMPARE
Trinidadian and Tobagonian
Ecuadorian
5th Grade
5th Grade Comparison
Trinidadians and Tobagonians
Ecuadorians
96.7%
5TH GRADE
0.1/ 100
METRIC RATING
272nd/ 347
METRIC RANK
96.0%
5TH GRADE
0.0/ 100
METRIC RATING
308th/ 347
METRIC RANK
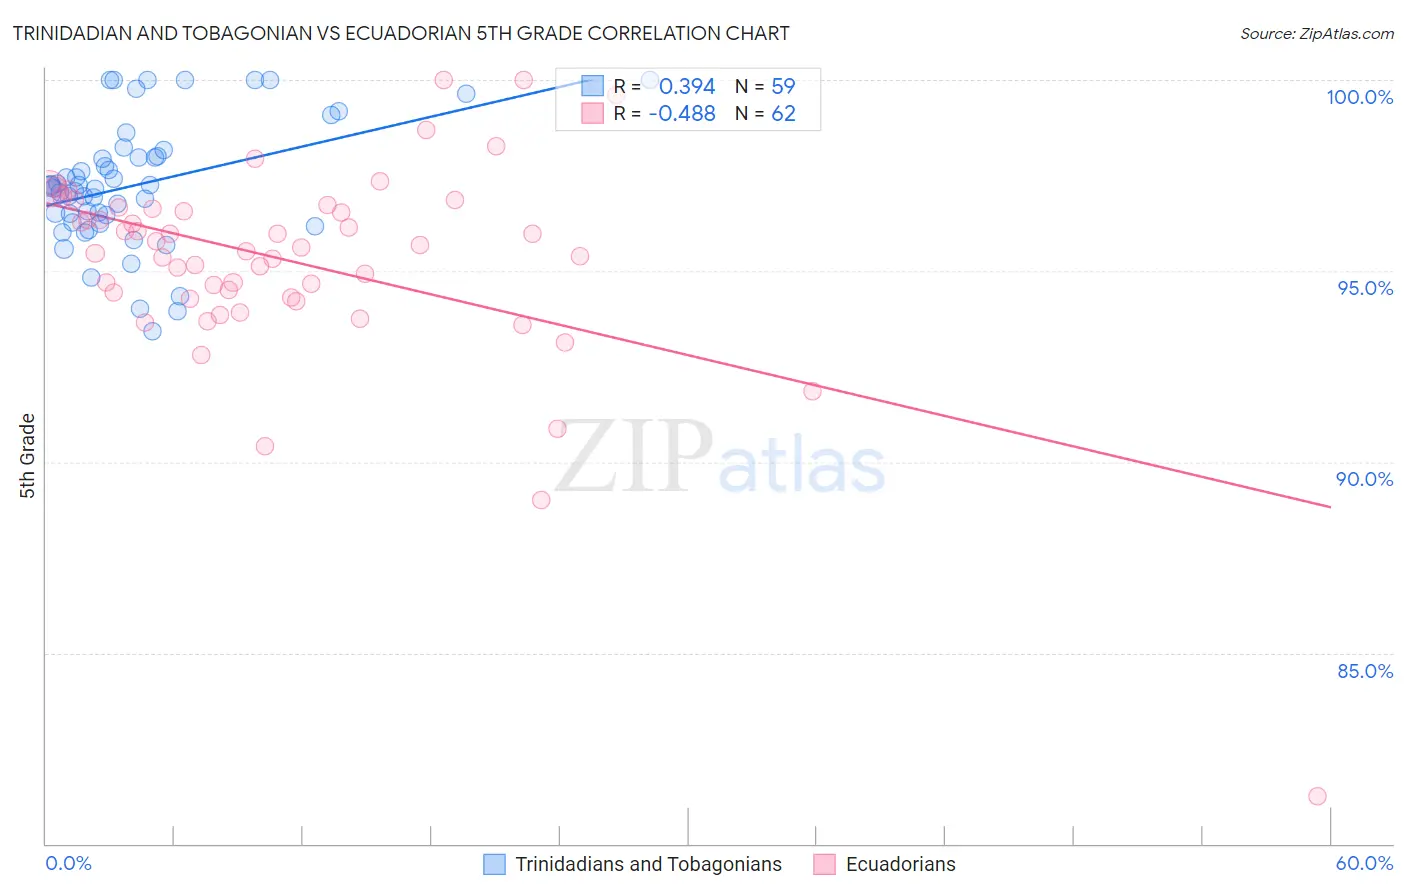
Trinidadian and Tobagonian vs Ecuadorian 5th Grade Correlation Chart
The statistical analysis conducted on geographies consisting of 219,882,819 people shows a mild positive correlation between the proportion of Trinidadians and Tobagonians and percentage of population with at least 5th grade education in the United States with a correlation coefficient (R) of 0.394 and weighted average of 96.7%. Similarly, the statistical analysis conducted on geographies consisting of 317,865,755 people shows a moderate negative correlation between the proportion of Ecuadorians and percentage of population with at least 5th grade education in the United States with a correlation coefficient (R) of -0.488 and weighted average of 96.0%, a difference of 0.67%.
5th Grade Correlation Summary
| Measurement | Trinidadian and Tobagonian | Ecuadorian |
| Minimum | 93.4% | 81.2% |
| Maximum | 100.0% | 100.0% |
| Range | 6.6% | 18.7% |
| Mean | 97.3% | 95.2% |
| Median | 97.2% | 95.6% |
| Interquartile 25% (IQ1) | 96.3% | 94.3% |
| Interquartile 75% (IQ3) | 98.0% | 96.6% |
| Interquartile Range (IQR) | 1.7% | 2.3% |
| Standard Deviation (Sample) | 1.6% | 2.7% |
| Standard Deviation (Population) | 1.6% | 2.7% |
Similar Demographics by 5th Grade
Demographics Similar to Trinidadians and Tobagonians by 5th Grade
In terms of 5th grade, the demographic groups most similar to Trinidadians and Tobagonians are Immigrants from Hong Kong (96.7%, a difference of 0.010%), Yaqui (96.7%, a difference of 0.010%), Immigrants from Cameroon (96.7%, a difference of 0.010%), Afghan (96.7%, a difference of 0.020%), and Immigrants from Peru (96.6%, a difference of 0.020%).
| Demographics | Rating | Rank | 5th Grade |
| Taiwanese | 0.3 /100 | #265 | Tragic 96.7% |
| Immigrants | Nigeria | 0.3 /100 | #266 | Tragic 96.7% |
| Immigrants | South America | 0.3 /100 | #267 | Tragic 96.7% |
| Armenians | 0.3 /100 | #268 | Tragic 96.7% |
| Ghanaians | 0.2 /100 | #269 | Tragic 96.7% |
| Afghans | 0.2 /100 | #270 | Tragic 96.7% |
| Immigrants | Hong Kong | 0.2 /100 | #271 | Tragic 96.7% |
| Trinidadians and Tobagonians | 0.1 /100 | #272 | Tragic 96.7% |
| Yaqui | 0.1 /100 | #273 | Tragic 96.7% |
| Immigrants | Cameroon | 0.1 /100 | #274 | Tragic 96.7% |
| Immigrants | Peru | 0.1 /100 | #275 | Tragic 96.6% |
| Cubans | 0.1 /100 | #276 | Tragic 96.6% |
| Immigrants | Bolivia | 0.1 /100 | #277 | Tragic 96.6% |
| Immigrants | Ghana | 0.1 /100 | #278 | Tragic 96.6% |
| Immigrants | Philippines | 0.1 /100 | #279 | Tragic 96.6% |
Demographics Similar to Ecuadorians by 5th Grade
In terms of 5th grade, the demographic groups most similar to Ecuadorians are Immigrants from Haiti (96.0%, a difference of 0.010%), Immigrants from Caribbean (96.0%, a difference of 0.010%), Immigrants from Guyana (96.0%, a difference of 0.010%), Immigrants from Laos (96.0%, a difference of 0.030%), and Immigrants from Burma/Myanmar (96.1%, a difference of 0.040%).
| Demographics | Rating | Rank | 5th Grade |
| Immigrants | Cuba | 0.0 /100 | #301 | Tragic 96.1% |
| Guyanese | 0.0 /100 | #302 | Tragic 96.1% |
| Puerto Ricans | 0.0 /100 | #303 | Tragic 96.1% |
| Immigrants | Burma/Myanmar | 0.0 /100 | #304 | Tragic 96.1% |
| Immigrants | Laos | 0.0 /100 | #305 | Tragic 96.0% |
| Immigrants | Haiti | 0.0 /100 | #306 | Tragic 96.0% |
| Immigrants | Caribbean | 0.0 /100 | #307 | Tragic 96.0% |
| Ecuadorians | 0.0 /100 | #308 | Tragic 96.0% |
| Immigrants | Guyana | 0.0 /100 | #309 | Tragic 96.0% |
| Indonesians | 0.0 /100 | #310 | Tragic 96.0% |
| Immigrants | Bangladesh | 0.0 /100 | #311 | Tragic 96.0% |
| Vietnamese | 0.0 /100 | #312 | Tragic 95.9% |
| Bangladeshis | 0.0 /100 | #313 | Tragic 95.9% |
| Immigrants | Portugal | 0.0 /100 | #314 | Tragic 95.9% |
| Nicaraguans | 0.0 /100 | #315 | Tragic 95.9% |