Tongan vs Bhutanese Bachelor's Degree

COMPARE

Tongan
Race
Ancestry
AfghanAfricanAlaska NativeAlaskan AthabascanAlbanianAleutAlsatianAmericanApacheArabArapahoArgentineanArmenianAssyrian/Chaldean/SyriacAustralianAustrianBahamianBangladeshiBarbadianBasqueBelgianBelizeanBermudanBlackfeetBolivianBrazilianBritishBritish West IndianBulgarianBurmeseCajunCambodianCanadianCape VerdeanCarpatho RusynCelticCentral AmericanCentral American IndianCherokeeCheyenneChickasawChileanChineseChippewaChoctawColombianColvilleComancheCosta RicanCreeCreekCroatianCrowCubanCypriotCzechCzechoslovakianDanishDelawareDominicanDutchDutch West IndianEastern EuropeanEcuadorianEgyptianEnglishEstonianEthiopianEuropeanFijianFilipinoFinnishFrenchFrench American IndianFrench CanadianGermanGerman RussianGhanaianGreekGuamanian/ChamorroGuatemalanGuyaneseHaitianHmongHonduranHopiHoumaHungarianIcelanderIndian (Asian)IndonesianInupiatIranianIraqiIrishIroquoisIsraeliItalianJamaicanJapaneseJordanianKenyanKiowaKoreanLaotianLatvianLebaneseLiberianLithuanianLumbeeLuxembourgerMacedonianMalaysianMalteseMarshalleseMenomineeMexicanMexican American IndianMongolianMoroccanNative HawaiianNavajoNepaleseNew ZealanderNicaraguanNigerianNorthern EuropeanNorwegianOkinawanOsageOttawaPaiutePakistaniPalestinianPanamanianParaguayanPennsylvania GermanPeruvianPimaPolishPortuguesePotawatomiPuebloPuerto RicanPuget Sound SalishRomanianRussianSalvadoranSamoanScandinavianScotch-IrishScottishSeminoleSenegaleseSerbianShoshoneSierra LeoneanSiouxSlavicSlovakSloveneSomaliSouth AfricanSouth AmericanSouth American IndianSoviet UnionSpaniardSpanishSpanish AmericanSpanish American IndianSri LankanSubsaharan AfricanSudaneseSwedishSwissSyrianTaiwaneseThaiTlingit-HaidaTohono O'OdhamTonganTrinidadian and TobagonianTsimshianTurkishU.S. Virgin IslanderUgandanUkrainianUruguayanUteVenezuelanVietnameseWelshWest IndianYakamaYaquiYugoslavianYumanYup'ikZimbabwean
Immigration
NonimmigrantsImmigrantsAfghanistanAfricaAlbaniaArgentinaArmeniaAsiaAustraliaAustriaBahamasBangladeshBarbadosBelarusBelgiumBelizeBoliviaBosnia and HerzegovinaBrazilBulgariaBurma/MyanmarCabo VerdeCambodiaCameroonCanadaCaribbeanCentral AmericaChileChinaColombiaCongoCosta RicaCroatiaCubaCzechoslovakiaDenmarkDominicaDominican RepublicEastern AfricaEastern AsiaEastern EuropeEcuadorEgyptEl SalvadorEnglandEritreaEthiopiaEuropeFijiFranceGermanyGhanaGreeceGrenadaGuatemalaGuyanaHaitiHondurasHong KongHungaryIndiaIndonesiaIranIraqIrelandIsraelItalyJamaicaJapanJordanKazakhstanKenyaKoreaKuwaitLaosLatin AmericaLatviaLebanonLiberiaLithuaniaMalaysiaMexicoMicronesiaMiddle AfricaMoldovaMoroccoNepalNetherlandsNicaraguaNigeriaNorth AmericaNorth MacedoniaNorthern AfricaNorthern EuropeNorwayOceaniaPakistanPanamaPeruPhilippinesPolandPortugalRomaniaRussiaSaudi ArabiaScotlandSenegalSerbiaSierra LeoneSingaporeSomaliaSouth AfricaSouth AmericaSouth Central AsiaSouth Eastern AsiaSouthern EuropeSpainSri LankaSt. Vincent and the GrenadinesSudanSwedenSwitzerlandSyriaTaiwanThailandTrinidad and TobagoTurkeyUgandaUkraineUruguayUzbekistanVenezuelaVietnamWest IndiesWestern AfricaWestern AsiaWestern EuropeYemenZaireZimbabweAzores
Bhutanese
Race
Ancestry
AfghanAfricanAlaska NativeAlaskan AthabascanAlbanianAleutAlsatianAmericanApacheArabArapahoArgentineanArmenianAssyrian/Chaldean/SyriacAustralianAustrianBahamianBangladeshiBarbadianBasqueBelgianBelizeanBermudanBhutaneseBlackfeetBolivianBrazilianBritishBritish West IndianBulgarianBurmeseCajunCambodianCanadianCape VerdeanCarpatho RusynCelticCentral AmericanCentral American IndianCherokeeCheyenneChickasawChileanChineseChippewaChoctawColombianColvilleComancheCosta RicanCreeCreekCroatianCrowCubanCypriotCzechCzechoslovakianDanishDelawareDominicanDutchDutch West IndianEastern EuropeanEcuadorianEgyptianEnglishEstonianEthiopianEuropeanFijianFilipinoFinnishFrenchFrench American IndianFrench CanadianGermanGerman RussianGhanaianGreekGuamanian/ChamorroGuatemalanGuyaneseHaitianHmongHonduranHopiHoumaHungarianIcelanderIndian (Asian)IndonesianInupiatIranianIraqiIrishIroquoisIsraeliItalianJamaicanJapaneseJordanianKenyanKiowaKoreanLaotianLatvianLebaneseLiberianLithuanianLumbeeLuxembourgerMacedonianMalaysianMalteseMarshalleseMenomineeMexicanMexican American IndianMongolianMoroccanNative HawaiianNavajoNepaleseNew ZealanderNicaraguanNigerianNorthern EuropeanNorwegianOkinawanOsageOttawaPaiutePakistaniPalestinianPanamanianParaguayanPennsylvania GermanPeruvianPimaPolishPortuguesePotawatomiPuebloPuerto RicanPuget Sound SalishRomanianRussianSalvadoranSamoanScandinavianScotch-IrishScottishSeminoleSenegaleseSerbianShoshoneSierra LeoneanSiouxSlavicSlovakSloveneSomaliSouth AfricanSouth AmericanSouth American IndianSoviet UnionSpaniardSpanishSpanish AmericanSpanish American IndianSri LankanSubsaharan AfricanSudaneseSwedishSwissSyrianTaiwaneseThaiTlingit-HaidaTohono O'OdhamTrinidadian and TobagonianTsimshianTurkishU.S. Virgin IslanderUgandanUkrainianUruguayanUteVenezuelanVietnameseWelshWest IndianYakamaYaquiYugoslavianYumanYup'ikZimbabwean
Immigration
NonimmigrantsImmigrantsAfghanistanAfricaAlbaniaArgentinaArmeniaAsiaAustraliaAustriaBahamasBangladeshBarbadosBelarusBelgiumBelizeBoliviaBosnia and HerzegovinaBrazilBulgariaBurma/MyanmarCabo VerdeCambodiaCameroonCanadaCaribbeanCentral AmericaChileChinaColombiaCongoCosta RicaCroatiaCubaCzechoslovakiaDenmarkDominicaDominican RepublicEastern AfricaEastern AsiaEastern EuropeEcuadorEgyptEl SalvadorEnglandEritreaEthiopiaEuropeFijiFranceGermanyGhanaGreeceGrenadaGuatemalaGuyanaHaitiHondurasHong KongHungaryIndiaIndonesiaIranIraqIrelandIsraelItalyJamaicaJapanJordanKazakhstanKenyaKoreaKuwaitLaosLatin AmericaLatviaLebanonLiberiaLithuaniaMalaysiaMexicoMicronesiaMiddle AfricaMoldovaMoroccoNepalNetherlandsNicaraguaNigeriaNorth AmericaNorth MacedoniaNorthern AfricaNorthern EuropeNorwayOceaniaPakistanPanamaPeruPhilippinesPolandPortugalRomaniaRussiaSaudi ArabiaScotlandSenegalSerbiaSierra LeoneSingaporeSomaliaSouth AfricaSouth AmericaSouth Central AsiaSouth Eastern AsiaSouthern EuropeSpainSri LankaSt. Vincent and the GrenadinesSudanSwedenSwitzerlandSyriaTaiwanThailandTrinidad and TobagoTurkeyUgandaUkraineUruguayUzbekistanVenezuelaVietnamWest IndiesWestern AfricaWestern AsiaWestern EuropeYemenZaireZimbabweAzores
Bachelor's Degree
Income
Poverty
Unemployment
Labor Participation
Family Structure
Vehicle Availability
Education Level
Disability

Bachelor's Degree Comparison

Tongans

Bhutanese

Tragic
Exceptional
34.3%
BACHELOR'S DEGREE
2.0/ 100
METRIC RATING
240th/ 347
METRIC RANK
42.7%
BACHELOR'S DEGREE
99.5/ 100
METRIC RATING
74th/ 347
METRIC RANK

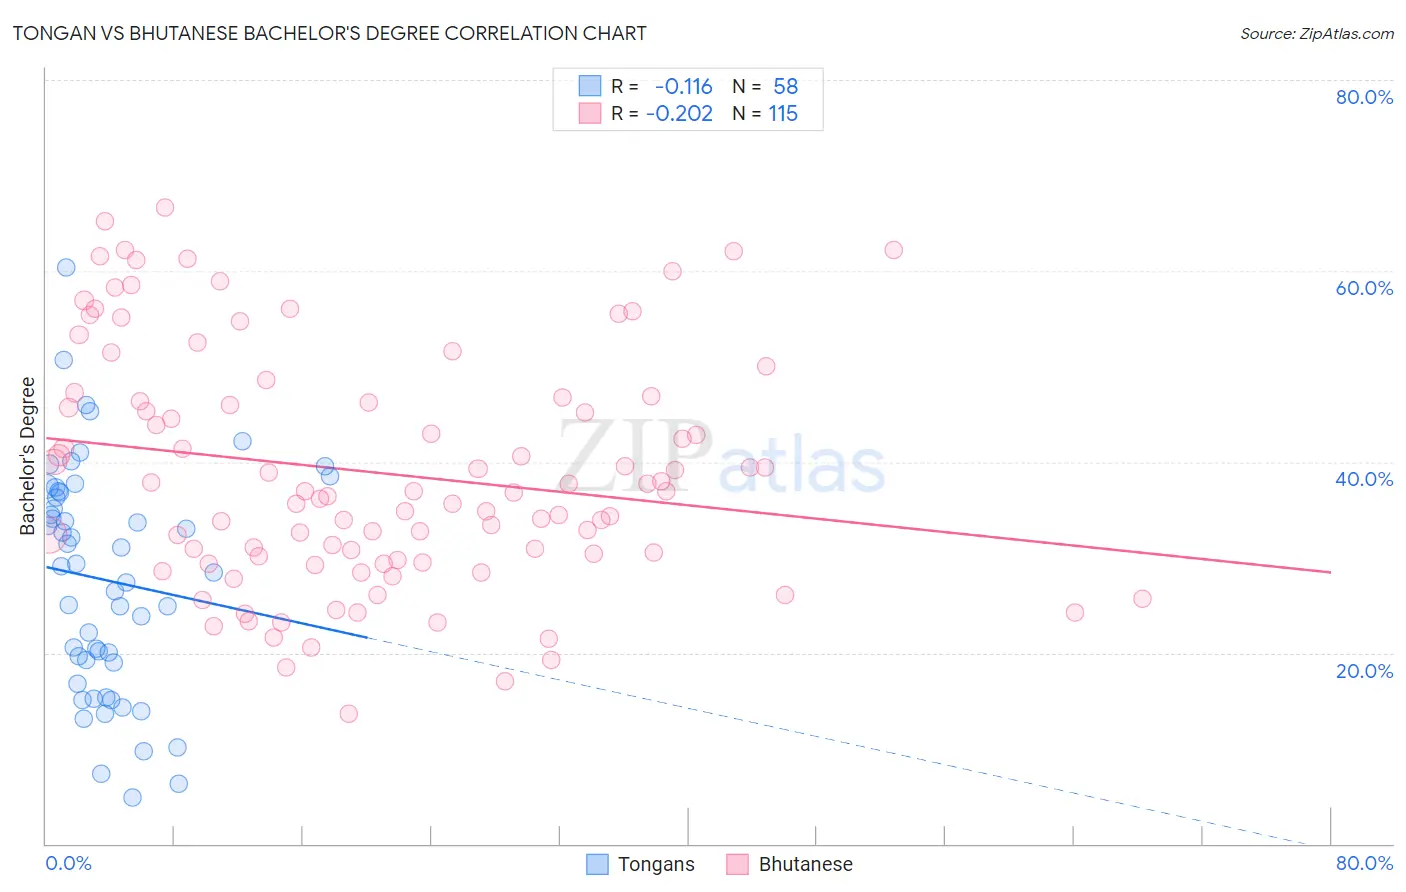
Tongan vs Bhutanese Bachelor's Degree Correlation Chart

The statistical analysis conducted on geographies consisting of 102,908,079 people shows a poor negative correlation between the proportion of Tongans and percentage of population with at least bachelor's degree education in the United States with a correlation coefficient (R) of -0.116 and weighted average of 34.3%. Similarly, the statistical analysis conducted on geographies consisting of 455,522,940 people shows a weak negative correlation between the proportion of Bhutanese and percentage of population with at least bachelor's degree education in the United States with a correlation coefficient (R) of -0.202 and weighted average of 42.7%, a difference of 24.5%.
Tongan vs Bhutanese Bachelor's Degree

Bachelor's Degree Correlation Summary

MeasurementTonganBhutanese
Minimum4.8%13.6%
Maximum60.4%66.7%
Range55.6%53.1%
Mean27.6%38.8%
Median28.7%36.9%
Interquartile 25% (IQ1)19.0%29.8%
Interquartile 75% (IQ3)36.8%46.7%
Interquartile Range (IQR)17.8%16.9%
Standard Deviation (Sample)11.9%12.4%
Standard Deviation (Population)11.8%12.3%

Similar Demographics by Bachelor's Degree

Demographics Similar to Tongans by Bachelor's Degree

In terms of bachelor's degree, the demographic groups most similar to Tongans are Immigrants from Cambodia (34.2%, a difference of 0.26%), Nonimmigrants (34.2%, a difference of 0.33%), British West Indian (34.5%, a difference of 0.54%), Guyanese (34.5%, a difference of 0.56%), and Tlingit-Haida (34.6%, a difference of 0.84%).
DemographicsRating | RankBachelor's Degree
Immigrants | Ecuador
3.3
/100
|
#233
Tragic
34.7%
Guamanians/Chamorros
3.0
/100
|
#234
Tragic
34.6%
Immigrants | West Indies
2.9
/100
|
#235
Tragic
34.6%
Liberians
2.8
/100
|
#236
Tragic
34.6%
Tlingit-Haida
2.8
/100
|
#237
Tragic
34.6%
Guyanese
2.5
/100
|
#238
Tragic
34.5%
British West Indians
2.5
/100
|
#239
Tragic
34.5%
Tongans
2.0
/100
|
#240
Tragic
34.3%
Immigrants | Cambodia
1.9
/100
|
#241
Tragic
34.2%
Immigrants | Nonimmigrants
1.8
/100
|
#242
Tragic
34.2%
Immigrants | Guyana
1.4
/100
|
#243
Tragic
33.9%
Delaware
1.2
/100
|
#244
Tragic
33.8%
Immigrants | Fiji
1.2
/100
|
#245
Tragic
33.7%
Jamaicans
1.0
/100
|
#246
Tragic
33.6%
Immigrants | Congo
1.0
/100
|
#247
Tragic
33.6%

Demographics Similar to Bhutanese by Bachelor's Degree

In terms of bachelor's degree, the demographic groups most similar to Bhutanese are Immigrants from Zimbabwe (42.6%, a difference of 0.21%), Immigrants from Uzbekistan (42.8%, a difference of 0.22%), Immigrants from Egypt (42.6%, a difference of 0.23%), Ethiopian (42.8%, a difference of 0.27%), and Immigrants from Argentina (42.8%, a difference of 0.36%).
DemographicsRating | RankBachelor's Degree
Egyptians
99.7
/100
|
#67
Exceptional
43.3%
Immigrants | Indonesia
99.7
/100
|
#68
Exceptional
43.3%
Immigrants | Pakistan
99.7
/100
|
#69
Exceptional
43.1%
Immigrants | Romania
99.6
/100
|
#70
Exceptional
42.9%
Immigrants | Argentina
99.6
/100
|
#71
Exceptional
42.8%
Ethiopians
99.5
/100
|
#72
Exceptional
42.8%
Immigrants | Uzbekistan
99.5
/100
|
#73
Exceptional
42.8%
Bhutanese
99.5
/100
|
#74
Exceptional
42.7%
Immigrants | Zimbabwe
99.4
/100
|
#75
Exceptional
42.6%
Immigrants | Egypt
99.4
/100
|
#76
Exceptional
42.6%
Immigrants | Eastern Europe
99.4
/100
|
#77
Exceptional
42.5%
Immigrants | Ethiopia
99.4
/100
|
#78
Exceptional
42.5%
Immigrants | Lebanon
99.3
/100
|
#79
Exceptional
42.4%
Immigrants | Croatia
99.2
/100
|
#80
Exceptional
42.3%
Immigrants | Hungary
99.2
/100
|
#81
Exceptional
42.3%