Taiwanese vs Nonimmigrants 8th Grade

COMPARE

Taiwanese
Race
Ancestry
AfghanAfricanAlaska NativeAlaskan AthabascanAlbanianAleutAlsatianAmericanApacheArabArapahoArgentineanArmenianAssyrian/Chaldean/SyriacAustralianAustrianBahamianBangladeshiBarbadianBasqueBelgianBelizeanBermudanBhutaneseBlackfeetBolivianBrazilianBritishBritish West IndianBulgarianBurmeseCajunCambodianCanadianCape VerdeanCarpatho RusynCelticCentral AmericanCentral American IndianCherokeeCheyenneChickasawChileanChineseChippewaChoctawColombianColvilleComancheCosta RicanCreeCreekCroatianCrowCubanCypriotCzechCzechoslovakianDanishDelawareDominicanDutchDutch West IndianEastern EuropeanEcuadorianEgyptianEnglishEstonianEthiopianEuropeanFijianFilipinoFinnishFrenchFrench American IndianFrench CanadianGermanGerman RussianGhanaianGreekGuamanian/ChamorroGuatemalanGuyaneseHaitianHmongHonduranHopiHoumaHungarianIcelanderIndian (Asian)IndonesianInupiatIranianIraqiIrishIroquoisIsraeliItalianJamaicanJapaneseJordanianKenyanKiowaKoreanLaotianLatvianLebaneseLiberianLithuanianLumbeeLuxembourgerMacedonianMalaysianMalteseMarshalleseMenomineeMexicanMexican American IndianMongolianMoroccanNative HawaiianNavajoNepaleseNew ZealanderNicaraguanNigerianNorthern EuropeanNorwegianOkinawanOsageOttawaPaiutePakistaniPalestinianPanamanianParaguayanPennsylvania GermanPeruvianPimaPolishPortuguesePotawatomiPuebloPuerto RicanPuget Sound SalishRomanianRussianSalvadoranSamoanScandinavianScotch-IrishScottishSeminoleSenegaleseSerbianShoshoneSierra LeoneanSiouxSlavicSlovakSloveneSomaliSouth AfricanSouth AmericanSouth American IndianSoviet UnionSpaniardSpanishSpanish AmericanSpanish American IndianSri LankanSubsaharan AfricanSudaneseSwedishSwissSyrianTaiwaneseThaiTlingit-HaidaTohono O'OdhamTonganTrinidadian and TobagonianTsimshianTurkishU.S. Virgin IslanderUgandanUkrainianUruguayanUteVenezuelanVietnameseWelshWest IndianYakamaYaquiYugoslavianYumanYup'ikZimbabwean
Immigration
ImmigrantsAfghanistanAfricaAlbaniaArgentinaArmeniaAsiaAustraliaAustriaBahamasBangladeshBarbadosBelarusBelgiumBelizeBoliviaBosnia and HerzegovinaBrazilBulgariaBurma/MyanmarCabo VerdeCambodiaCameroonCanadaCaribbeanCentral AmericaChileChinaColombiaCongoCosta RicaCroatiaCubaCzechoslovakiaDenmarkDominicaDominican RepublicEastern AfricaEastern AsiaEastern EuropeEcuadorEgyptEl SalvadorEnglandEritreaEthiopiaEuropeFijiFranceGermanyGhanaGreeceGrenadaGuatemalaGuyanaHaitiHondurasHong KongHungaryIndiaIndonesiaIranIraqIrelandIsraelItalyJamaicaJapanJordanKazakhstanKenyaKoreaKuwaitLaosLatin AmericaLatviaLebanonLiberiaLithuaniaMalaysiaMexicoMicronesiaMiddle AfricaMoldovaMoroccoNepalNetherlandsNicaraguaNigeriaNorth AmericaNorth MacedoniaNorthern AfricaNorthern EuropeNorwayOceaniaPakistanPanamaPeruPhilippinesPolandPortugalRomaniaRussiaSaudi ArabiaScotlandSenegalSerbiaSierra LeoneSingaporeSomaliaSouth AfricaSouth AmericaSouth Central AsiaSouth Eastern AsiaSouthern EuropeSpainSri LankaSt. Vincent and the GrenadinesSudanSwedenSwitzerlandSyriaTaiwanThailandTrinidad and TobagoTurkeyUgandaUkraineUruguayUzbekistanVenezuelaVietnamWest IndiesWestern AfricaWestern AsiaWestern EuropeYemenZaireZimbabweAzores
Nonimmigrants
Race
Ancestry
AfghanAfricanAlaska NativeAlaskan AthabascanAlbanianAleutAlsatianAmericanApacheArabArapahoArgentineanArmenianAssyrian/Chaldean/SyriacAustralianAustrianBahamianBangladeshiBarbadianBasqueBelgianBelizeanBermudanBhutaneseBlackfeetBolivianBrazilianBritishBritish West IndianBulgarianBurmeseCajunCambodianCanadianCape VerdeanCarpatho RusynCelticCentral AmericanCentral American IndianCherokeeCheyenneChickasawChileanChineseChippewaChoctawColombianColvilleComancheCosta RicanCreeCreekCroatianCrowCubanCypriotCzechCzechoslovakianDanishDelawareDominicanDutchDutch West IndianEastern EuropeanEcuadorianEgyptianEnglishEstonianEthiopianEuropeanFijianFilipinoFinnishFrenchFrench American IndianFrench CanadianGermanGerman RussianGhanaianGreekGuamanian/ChamorroGuatemalanGuyaneseHaitianHmongHonduranHopiHoumaHungarianIcelanderIndian (Asian)IndonesianInupiatIranianIraqiIrishIroquoisIsraeliItalianJamaicanJapaneseJordanianKenyanKiowaKoreanLaotianLatvianLebaneseLiberianLithuanianLumbeeLuxembourgerMacedonianMalaysianMalteseMarshalleseMenomineeMexicanMexican American IndianMongolianMoroccanNative HawaiianNavajoNepaleseNew ZealanderNicaraguanNigerianNorthern EuropeanNorwegianOkinawanOsageOttawaPaiutePakistaniPalestinianPanamanianParaguayanPennsylvania GermanPeruvianPimaPolishPortuguesePotawatomiPuebloPuerto RicanPuget Sound SalishRomanianRussianSalvadoranSamoanScandinavianScotch-IrishScottishSeminoleSenegaleseSerbianShoshoneSierra LeoneanSiouxSlavicSlovakSloveneSomaliSouth AfricanSouth AmericanSouth American IndianSoviet UnionSpaniardSpanishSpanish AmericanSpanish American IndianSri LankanSubsaharan AfricanSudaneseSwedishSwissSyrianThaiTlingit-HaidaTohono O'OdhamTonganTrinidadian and TobagonianTsimshianTurkishU.S. Virgin IslanderUgandanUkrainianUruguayanUteVenezuelanVietnameseWelshWest IndianYakamaYaquiYugoslavianYumanYup'ikZimbabwean
Immigration
NonimmigrantsImmigrantsAfghanistanAfricaAlbaniaArgentinaArmeniaAsiaAustraliaAustriaBahamasBangladeshBarbadosBelarusBelgiumBelizeBoliviaBosnia and HerzegovinaBrazilBulgariaBurma/MyanmarCabo VerdeCambodiaCameroonCanadaCaribbeanCentral AmericaChileChinaColombiaCongoCosta RicaCroatiaCubaCzechoslovakiaDenmarkDominicaDominican RepublicEastern AfricaEastern AsiaEastern EuropeEcuadorEgyptEl SalvadorEnglandEritreaEthiopiaEuropeFijiFranceGermanyGhanaGreeceGrenadaGuatemalaGuyanaHaitiHondurasHong KongHungaryIndiaIndonesiaIranIraqIrelandIsraelItalyJamaicaJapanJordanKazakhstanKenyaKoreaKuwaitLaosLatin AmericaLatviaLebanonLiberiaLithuaniaMalaysiaMexicoMicronesiaMiddle AfricaMoldovaMoroccoNepalNetherlandsNicaraguaNigeriaNorth AmericaNorth MacedoniaNorthern AfricaNorthern EuropeNorwayOceaniaPakistanPanamaPeruPhilippinesPolandPortugalRomaniaRussiaSaudi ArabiaScotlandSenegalSerbiaSierra LeoneSingaporeSomaliaSouth AfricaSouth AmericaSouth Central AsiaSouth Eastern AsiaSouthern EuropeSpainSri LankaSt. Vincent and the GrenadinesSudanSwedenSwitzerlandSyriaTaiwanThailandTrinidad and TobagoTurkeyUgandaUkraineUruguayUzbekistanVenezuelaVietnamWest IndiesWestern AfricaWestern AsiaWestern EuropeYemenZaireZimbabweAzores
8th Grade
Income
Poverty
Unemployment
Labor Participation
Family Structure
Vehicle Availability
Education Level
Disability

8th Grade Comparison

Taiwanese

Nonimmigrants

Tragic
Exceptional
94.7%
8TH GRADE
0.1/ 100
METRIC RATING
277th/ 347
METRIC RANK
96.2%
8TH GRADE
96.0/ 100
METRIC RATING
116th/ 347
METRIC RANK

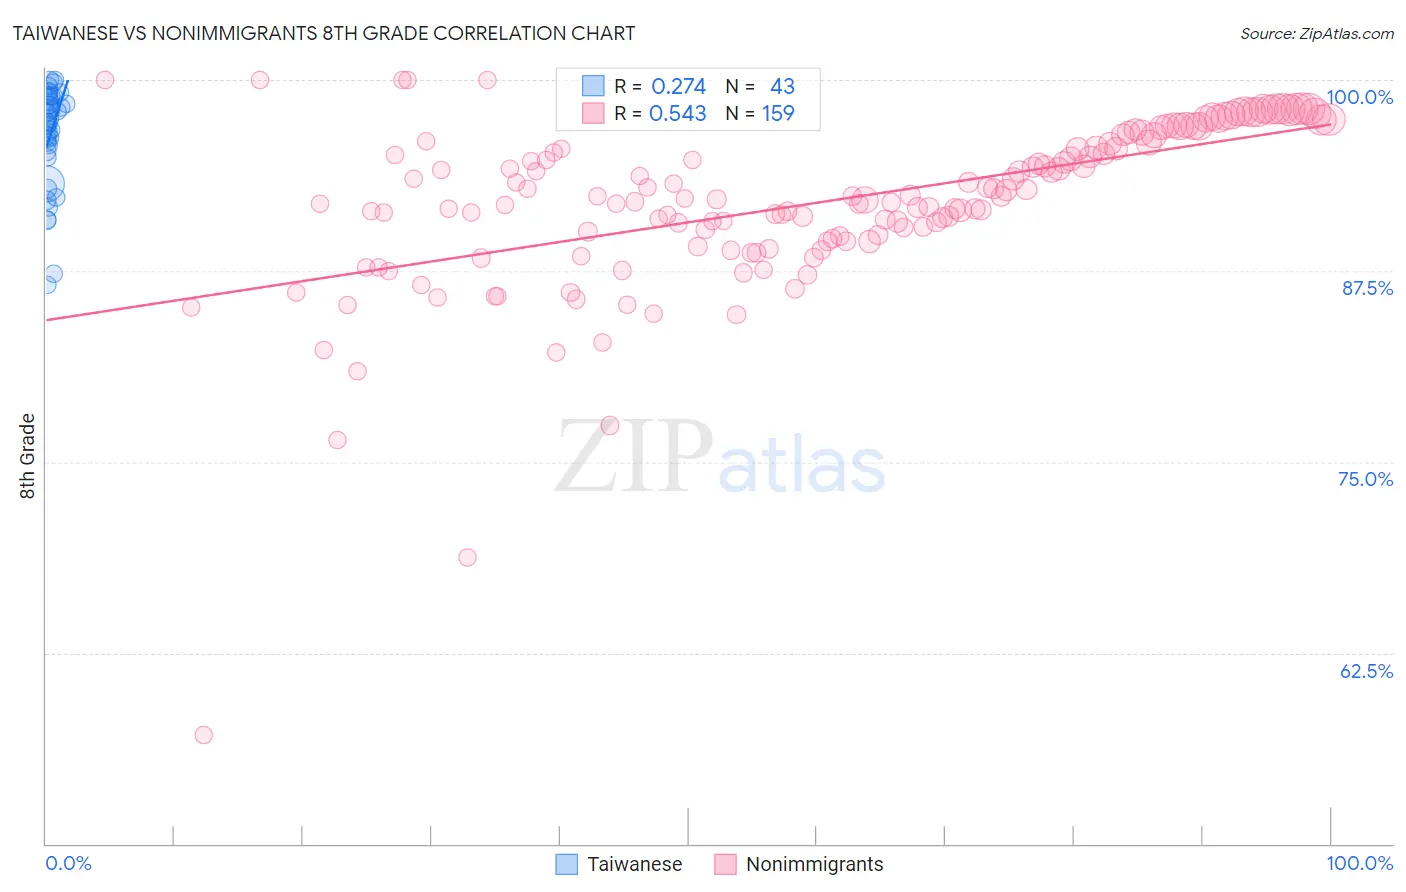
Taiwanese vs Nonimmigrants 8th Grade Correlation Chart

The statistical analysis conducted on geographies consisting of 31,677,387 people shows a weak positive correlation between the proportion of Taiwanese and percentage of population with at least 8th grade education in the United States with a correlation coefficient (R) of 0.274 and weighted average of 94.7%. Similarly, the statistical analysis conducted on geographies consisting of 585,374,268 people shows a substantial positive correlation between the proportion of Nonimmigrants and percentage of population with at least 8th grade education in the United States with a correlation coefficient (R) of 0.543 and weighted average of 96.2%, a difference of 1.6%.
Taiwanese vs Nonimmigrants 8th Grade

8th Grade Correlation Summary

MeasurementTaiwaneseNonimmigrants
Minimum86.6%57.2%
Maximum100.0%100.0%
Range13.4%42.8%
Mean96.4%91.9%
Median97.3%92.2%
Interquartile 25% (IQ1)95.4%89.5%
Interquartile 75% (IQ3)98.9%95.8%
Interquartile Range (IQR)3.5%6.3%
Standard Deviation (Sample)3.3%5.6%
Standard Deviation (Population)3.3%5.6%

Similar Demographics by 8th Grade

Demographics Similar to Taiwanese by 8th Grade

In terms of 8th grade, the demographic groups most similar to Taiwanese are Peruvian (94.7%, a difference of 0.030%), Armenian (94.7%, a difference of 0.030%), Immigrants from Trinidad and Tobago (94.6%, a difference of 0.040%), Barbadian (94.6%, a difference of 0.040%), and Immigrants from Bolivia (94.6%, a difference of 0.040%).
DemographicsRating | Rank8th Grade
Immigrants | Uzbekistan
0.2
/100
|
#270
Tragic
94.8%
Immigrants | Afghanistan
0.2
/100
|
#271
Tragic
94.8%
Immigrants | South America
0.2
/100
|
#272
Tragic
94.8%
Immigrants | Western Africa
0.2
/100
|
#273
Tragic
94.8%
Trinidadians and Tobagonians
0.2
/100
|
#274
Tragic
94.7%
Immigrants | Colombia
0.2
/100
|
#275
Tragic
94.7%
Peruvians
0.1
/100
|
#276
Tragic
94.7%
Taiwanese
0.1
/100
|
#277
Tragic
94.7%
Armenians
0.1
/100
|
#278
Tragic
94.7%
Immigrants | Trinidad and Tobago
0.1
/100
|
#279
Tragic
94.6%
Barbadians
0.1
/100
|
#280
Tragic
94.6%
Immigrants | Bolivia
0.1
/100
|
#281
Tragic
94.6%
Immigrants | Eritrea
0.1
/100
|
#282
Tragic
94.6%
Immigrants | St. Vincent and the Grenadines
0.1
/100
|
#283
Tragic
94.6%
Immigrants | Philippines
0.1
/100
|
#284
Tragic
94.6%

Demographics Similar to Nonimmigrants by 8th Grade

In terms of 8th grade, the demographic groups most similar to Nonimmigrants are Immigrants from Croatia (96.2%, a difference of 0.0%), Immigrants from Norway (96.2%, a difference of 0.010%), Immigrants from Japan (96.2%, a difference of 0.020%), Immigrants from Moldova (96.2%, a difference of 0.020%), and Shoshone (96.3%, a difference of 0.030%).
DemographicsRating | Rank8th Grade
Iroquois
97.5
/100
|
#109
Exceptional
96.3%
Cajuns
97.1
/100
|
#110
Exceptional
96.3%
Shoshone
96.8
/100
|
#111
Exceptional
96.3%
Syrians
96.7
/100
|
#112
Exceptional
96.3%
Immigrants | Zimbabwe
96.7
/100
|
#113
Exceptional
96.3%
Immigrants | Japan
96.5
/100
|
#114
Exceptional
96.2%
Immigrants | Moldova
96.5
/100
|
#115
Exceptional
96.2%
Immigrants | Nonimmigrants
96.0
/100
|
#116
Exceptional
96.2%
Immigrants | Croatia
96.0
/100
|
#117
Exceptional
96.2%
Immigrants | Norway
95.7
/100
|
#118
Exceptional
96.2%
Immigrants | Switzerland
95.3
/100
|
#119
Exceptional
96.2%
Immigrants | France
95.3
/100
|
#120
Exceptional
96.2%
Immigrants | Bulgaria
95.3
/100
|
#121
Exceptional
96.2%
Immigrants | Europe
95.3
/100
|
#122
Exceptional
96.2%
Filipinos
94.6
/100
|
#123
Exceptional
96.2%