Taiwanese vs Japanese Doctorate Degree
COMPARE
Taiwanese
Japanese
Doctorate Degree
Doctorate Degree Comparison
Taiwanese
Japanese
2.1%
DOCTORATE DEGREE
96.7/ 100
METRIC RATING
115th/ 347
METRIC RANK
1.5%
DOCTORATE DEGREE
0.9/ 100
METRIC RATING
260th/ 347
METRIC RANK
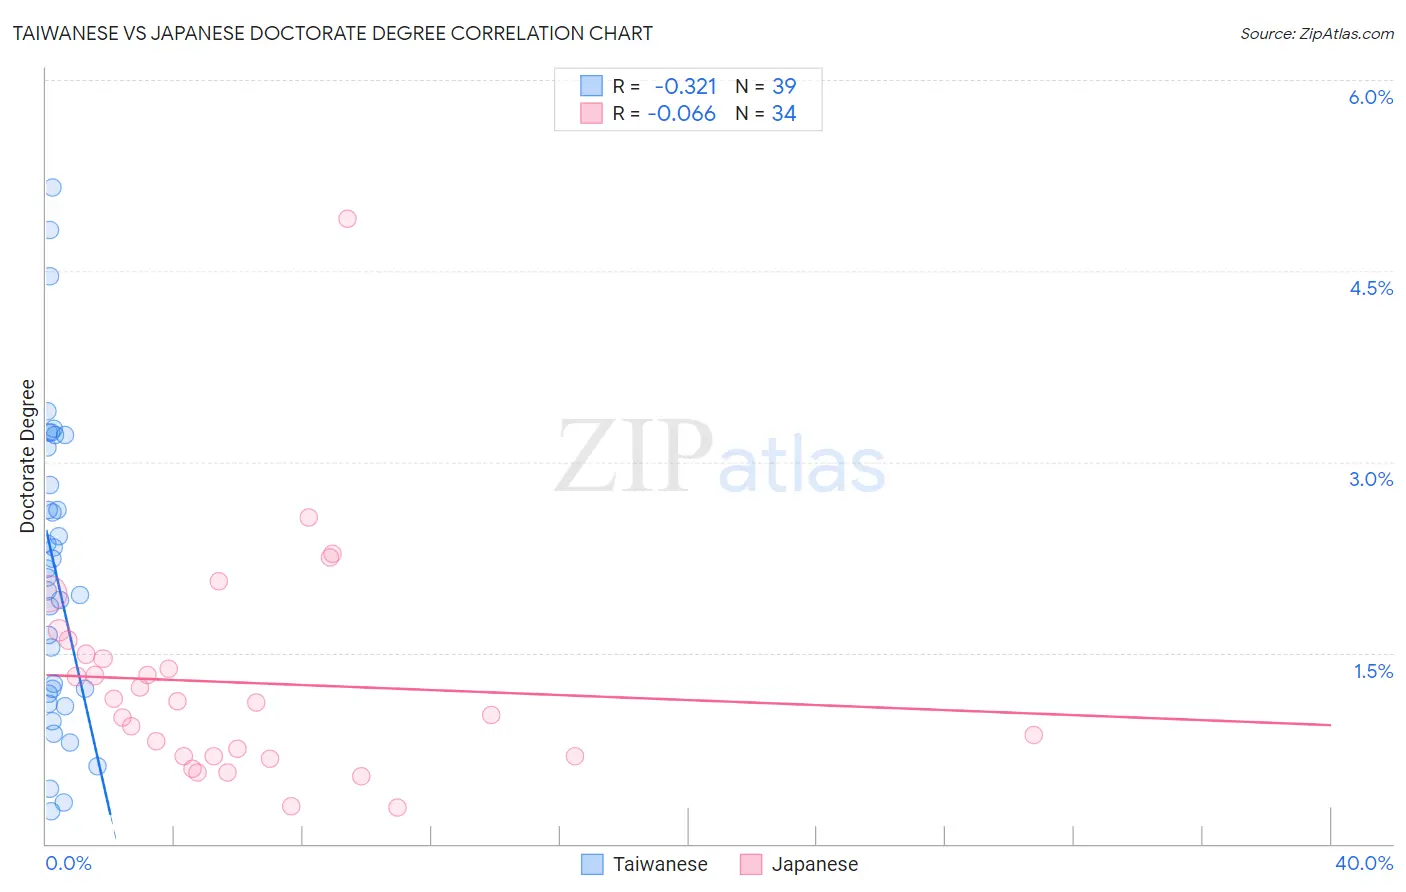
Taiwanese vs Japanese Doctorate Degree Correlation Chart
The statistical analysis conducted on geographies consisting of 31,440,416 people shows a mild negative correlation between the proportion of Taiwanese and percentage of population with at least doctorate degree education in the United States with a correlation coefficient (R) of -0.321 and weighted average of 2.1%. Similarly, the statistical analysis conducted on geographies consisting of 247,895,827 people shows a slight negative correlation between the proportion of Japanese and percentage of population with at least doctorate degree education in the United States with a correlation coefficient (R) of -0.066 and weighted average of 1.5%, a difference of 36.0%.
Doctorate Degree Correlation Summary
| Measurement | Taiwanese | Japanese |
| Minimum | 0.25% | 0.29% |
| Maximum | 5.2% | 4.9% |
| Range | 4.9% | 4.6% |
| Mean | 2.1% | 1.3% |
| Median | 2.1% | 1.1% |
| Interquartile 25% (IQ1) | 1.2% | 0.69% |
| Interquartile 75% (IQ3) | 3.1% | 1.5% |
| Interquartile Range (IQR) | 1.9% | 0.80% |
| Standard Deviation (Sample) | 1.2% | 0.87% |
| Standard Deviation (Population) | 1.2% | 0.85% |
Similar Demographics by Doctorate Degree
Demographics Similar to Taiwanese by Doctorate Degree
In terms of doctorate degree, the demographic groups most similar to Taiwanese are Immigrants from Croatia (2.1%, a difference of 0.080%), Immigrants from Italy (2.1%, a difference of 0.23%), Syrian (2.1%, a difference of 0.44%), Immigrants from Pakistan (2.1%, a difference of 0.46%), and Maltese (2.1%, a difference of 0.46%).
| Demographics | Rating | Rank | Doctorate Degree |
| Immigrants | Germany | 97.3 /100 | #108 | Exceptional 2.1% |
| Ukrainians | 97.2 /100 | #109 | Exceptional 2.1% |
| Brazilians | 97.2 /100 | #110 | Exceptional 2.1% |
| Immigrants | Pakistan | 97.1 /100 | #111 | Exceptional 2.1% |
| Syrians | 97.1 /100 | #112 | Exceptional 2.1% |
| Immigrants | Italy | 96.9 /100 | #113 | Exceptional 2.1% |
| Immigrants | Croatia | 96.8 /100 | #114 | Exceptional 2.1% |
| Taiwanese | 96.7 /100 | #115 | Exceptional 2.1% |
| Maltese | 96.2 /100 | #116 | Exceptional 2.1% |
| Lebanese | 96.0 /100 | #117 | Exceptional 2.1% |
| Icelanders | 96.0 /100 | #118 | Exceptional 2.1% |
| Pakistanis | 95.8 /100 | #119 | Exceptional 2.0% |
| Immigrants | Morocco | 95.5 /100 | #120 | Exceptional 2.0% |
| Immigrants | Jordan | 94.8 /100 | #121 | Exceptional 2.0% |
| Immigrants | Southern Europe | 94.7 /100 | #122 | Exceptional 2.0% |
Demographics Similar to Japanese by Doctorate Degree
In terms of doctorate degree, the demographic groups most similar to Japanese are Liberian (1.5%, a difference of 0.10%), Immigrants from West Indies (1.5%, a difference of 0.12%), Chippewa (1.5%, a difference of 0.38%), Immigrants from Portugal (1.5%, a difference of 0.46%), and Central American Indian (1.5%, a difference of 0.60%).
| Demographics | Rating | Rank | Doctorate Degree |
| Americans | 1.0 /100 | #253 | Tragic 1.5% |
| Immigrants | Cambodia | 1.0 /100 | #254 | Tragic 1.5% |
| Trinidadians and Tobagonians | 1.0 /100 | #255 | Tragic 1.5% |
| Central American Indians | 1.0 /100 | #256 | Tragic 1.5% |
| Chippewa | 0.9 /100 | #257 | Tragic 1.5% |
| Immigrants | West Indies | 0.9 /100 | #258 | Tragic 1.5% |
| Liberians | 0.9 /100 | #259 | Tragic 1.5% |
| Japanese | 0.9 /100 | #260 | Tragic 1.5% |
| Immigrants | Portugal | 0.8 /100 | #261 | Tragic 1.5% |
| Chickasaw | 0.7 /100 | #262 | Tragic 1.5% |
| Immigrants | Bahamas | 0.7 /100 | #263 | Tragic 1.5% |
| Blackfeet | 0.7 /100 | #264 | Tragic 1.5% |
| Nicaraguans | 0.6 /100 | #265 | Tragic 1.5% |
| Immigrants | Liberia | 0.5 /100 | #266 | Tragic 1.5% |
| Kiowa | 0.5 /100 | #267 | Tragic 1.5% |