Taiwanese vs Immigrants from South Central Asia 10th Grade

COMPARE

Taiwanese
Race
Ancestry
AfghanAfricanAlaska NativeAlaskan AthabascanAlbanianAleutAlsatianAmericanApacheArabArapahoArgentineanArmenianAssyrian/Chaldean/SyriacAustralianAustrianBahamianBangladeshiBarbadianBasqueBelgianBelizeanBermudanBhutaneseBlackfeetBolivianBrazilianBritishBritish West IndianBulgarianBurmeseCajunCambodianCanadianCape VerdeanCarpatho RusynCelticCentral AmericanCentral American IndianCherokeeCheyenneChickasawChileanChineseChippewaChoctawColombianColvilleComancheCosta RicanCreeCreekCroatianCrowCubanCypriotCzechCzechoslovakianDanishDelawareDominicanDutchDutch West IndianEastern EuropeanEcuadorianEgyptianEnglishEstonianEthiopianEuropeanFijianFilipinoFinnishFrenchFrench American IndianFrench CanadianGermanGerman RussianGhanaianGreekGuamanian/ChamorroGuatemalanGuyaneseHaitianHmongHonduranHopiHoumaHungarianIcelanderIndian (Asian)IndonesianInupiatIranianIraqiIrishIroquoisIsraeliItalianJamaicanJapaneseJordanianKenyanKiowaKoreanLaotianLatvianLebaneseLiberianLithuanianLumbeeLuxembourgerMacedonianMalaysianMalteseMarshalleseMenomineeMexicanMexican American IndianMongolianMoroccanNative HawaiianNavajoNepaleseNew ZealanderNicaraguanNigerianNorthern EuropeanNorwegianOkinawanOsageOttawaPaiutePakistaniPalestinianPanamanianParaguayanPennsylvania GermanPeruvianPimaPolishPortuguesePotawatomiPuebloPuerto RicanPuget Sound SalishRomanianRussianSalvadoranSamoanScandinavianScotch-IrishScottishSeminoleSenegaleseSerbianShoshoneSierra LeoneanSiouxSlavicSlovakSloveneSomaliSouth AfricanSouth AmericanSouth American IndianSoviet UnionSpaniardSpanishSpanish AmericanSpanish American IndianSri LankanSubsaharan AfricanSudaneseSwedishSwissSyrianTaiwaneseThaiTlingit-HaidaTohono O'OdhamTonganTrinidadian and TobagonianTsimshianTurkishU.S. Virgin IslanderUgandanUkrainianUruguayanUteVenezuelanVietnameseWelshWest IndianYakamaYaquiYugoslavianYumanYup'ikZimbabwean
Immigration
NonimmigrantsImmigrantsAfghanistanAfricaAlbaniaArgentinaArmeniaAsiaAustraliaAustriaBahamasBangladeshBarbadosBelarusBelgiumBelizeBoliviaBosnia and HerzegovinaBrazilBulgariaBurma/MyanmarCabo VerdeCambodiaCameroonCanadaCaribbeanCentral AmericaChileChinaColombiaCongoCosta RicaCroatiaCubaCzechoslovakiaDenmarkDominicaDominican RepublicEastern AfricaEastern AsiaEastern EuropeEcuadorEgyptEl SalvadorEnglandEritreaEthiopiaEuropeFijiFranceGermanyGhanaGreeceGrenadaGuatemalaGuyanaHaitiHondurasHong KongHungaryIndiaIndonesiaIranIraqIrelandIsraelItalyJamaicaJapanJordanKazakhstanKenyaKoreaKuwaitLaosLatin AmericaLatviaLebanonLiberiaLithuaniaMalaysiaMexicoMicronesiaMiddle AfricaMoldovaMoroccoNepalNetherlandsNicaraguaNigeriaNorth AmericaNorth MacedoniaNorthern AfricaNorthern EuropeNorwayOceaniaPakistanPanamaPeruPhilippinesPolandPortugalRomaniaRussiaSaudi ArabiaScotlandSenegalSerbiaSierra LeoneSingaporeSomaliaSouth AfricaSouth AmericaSouth Eastern AsiaSouthern EuropeSpainSri LankaSt. Vincent and the GrenadinesSudanSwedenSwitzerlandSyriaTaiwanThailandTrinidad and TobagoTurkeyUgandaUkraineUruguayUzbekistanVenezuelaVietnamWest IndiesWestern AfricaWestern AsiaWestern EuropeYemenZaireZimbabweAzores
Immigrants from South Central Asia
Race
Ancestry
AfghanAfricanAlaska NativeAlaskan AthabascanAlbanianAleutAlsatianAmericanApacheArabArapahoArgentineanArmenianAssyrian/Chaldean/SyriacAustralianAustrianBahamianBangladeshiBarbadianBasqueBelgianBelizeanBermudanBhutaneseBlackfeetBolivianBrazilianBritishBritish West IndianBulgarianBurmeseCajunCambodianCanadianCape VerdeanCarpatho RusynCelticCentral AmericanCentral American IndianCherokeeCheyenneChickasawChileanChineseChippewaChoctawColombianColvilleComancheCosta RicanCreeCreekCroatianCrowCubanCypriotCzechCzechoslovakianDanishDelawareDominicanDutchDutch West IndianEastern EuropeanEcuadorianEgyptianEnglishEstonianEthiopianEuropeanFijianFilipinoFinnishFrenchFrench American IndianFrench CanadianGermanGerman RussianGhanaianGreekGuamanian/ChamorroGuatemalanGuyaneseHaitianHmongHonduranHopiHoumaHungarianIcelanderIndian (Asian)IndonesianInupiatIranianIraqiIrishIroquoisIsraeliItalianJamaicanJapaneseJordanianKenyanKiowaKoreanLaotianLatvianLebaneseLiberianLithuanianLumbeeLuxembourgerMacedonianMalaysianMalteseMarshalleseMenomineeMexicanMexican American IndianMongolianMoroccanNative HawaiianNavajoNepaleseNew ZealanderNicaraguanNigerianNorthern EuropeanNorwegianOkinawanOsageOttawaPaiutePakistaniPalestinianPanamanianParaguayanPennsylvania GermanPeruvianPimaPolishPortuguesePotawatomiPuebloPuerto RicanPuget Sound SalishRomanianRussianSalvadoranSamoanScandinavianScotch-IrishScottishSeminoleSenegaleseSerbianShoshoneSierra LeoneanSiouxSlavicSlovakSloveneSomaliSouth AfricanSouth AmericanSouth American IndianSoviet UnionSpaniardSpanishSpanish AmericanSpanish American IndianSri LankanSubsaharan AfricanSudaneseSwedishSwissSyrianThaiTlingit-HaidaTohono O'OdhamTonganTrinidadian and TobagonianTsimshianTurkishU.S. Virgin IslanderUgandanUkrainianUruguayanUteVenezuelanVietnameseWelshWest IndianYakamaYaquiYugoslavianYumanYup'ikZimbabwean
Immigration
NonimmigrantsImmigrantsAfghanistanAfricaAlbaniaArgentinaArmeniaAsiaAustraliaAustriaBahamasBangladeshBarbadosBelarusBelgiumBelizeBoliviaBosnia and HerzegovinaBrazilBulgariaBurma/MyanmarCabo VerdeCambodiaCameroonCanadaCaribbeanCentral AmericaChileChinaColombiaCongoCosta RicaCroatiaCubaCzechoslovakiaDenmarkDominicaDominican RepublicEastern AfricaEastern AsiaEastern EuropeEcuadorEgyptEl SalvadorEnglandEritreaEthiopiaEuropeFijiFranceGermanyGhanaGreeceGrenadaGuatemalaGuyanaHaitiHondurasHong KongHungaryIndiaIndonesiaIranIraqIrelandIsraelItalyJamaicaJapanJordanKazakhstanKenyaKoreaKuwaitLaosLatin AmericaLatviaLebanonLiberiaLithuaniaMalaysiaMexicoMicronesiaMiddle AfricaMoldovaMoroccoNepalNetherlandsNicaraguaNigeriaNorth AmericaNorth MacedoniaNorthern AfricaNorthern EuropeNorwayOceaniaPakistanPanamaPeruPhilippinesPolandPortugalRomaniaRussiaSaudi ArabiaScotlandSenegalSerbiaSierra LeoneSingaporeSomaliaSouth AfricaSouth AmericaSouth Central AsiaSouth Eastern AsiaSouthern EuropeSpainSri LankaSt. Vincent and the GrenadinesSudanSwedenSwitzerlandSyriaTaiwanThailandTrinidad and TobagoTurkeyUgandaUkraineUruguayUzbekistanVenezuelaVietnamWest IndiesWestern AfricaWestern AsiaWestern EuropeYemenZaireZimbabweAzores
10th Grade
Income
Poverty
Unemployment
Labor Participation
Family Structure
Vehicle Availability
Education Level
Disability

10th Grade Comparison

Taiwanese

Immigrants from South Central Asia

Tragic
Exceptional
92.5%
10TH GRADE
0.3/ 100
METRIC RATING
267th/ 347
METRIC RANK
94.5%
10TH GRADE
97.8/ 100
METRIC RATING
100th/ 347
METRIC RANK

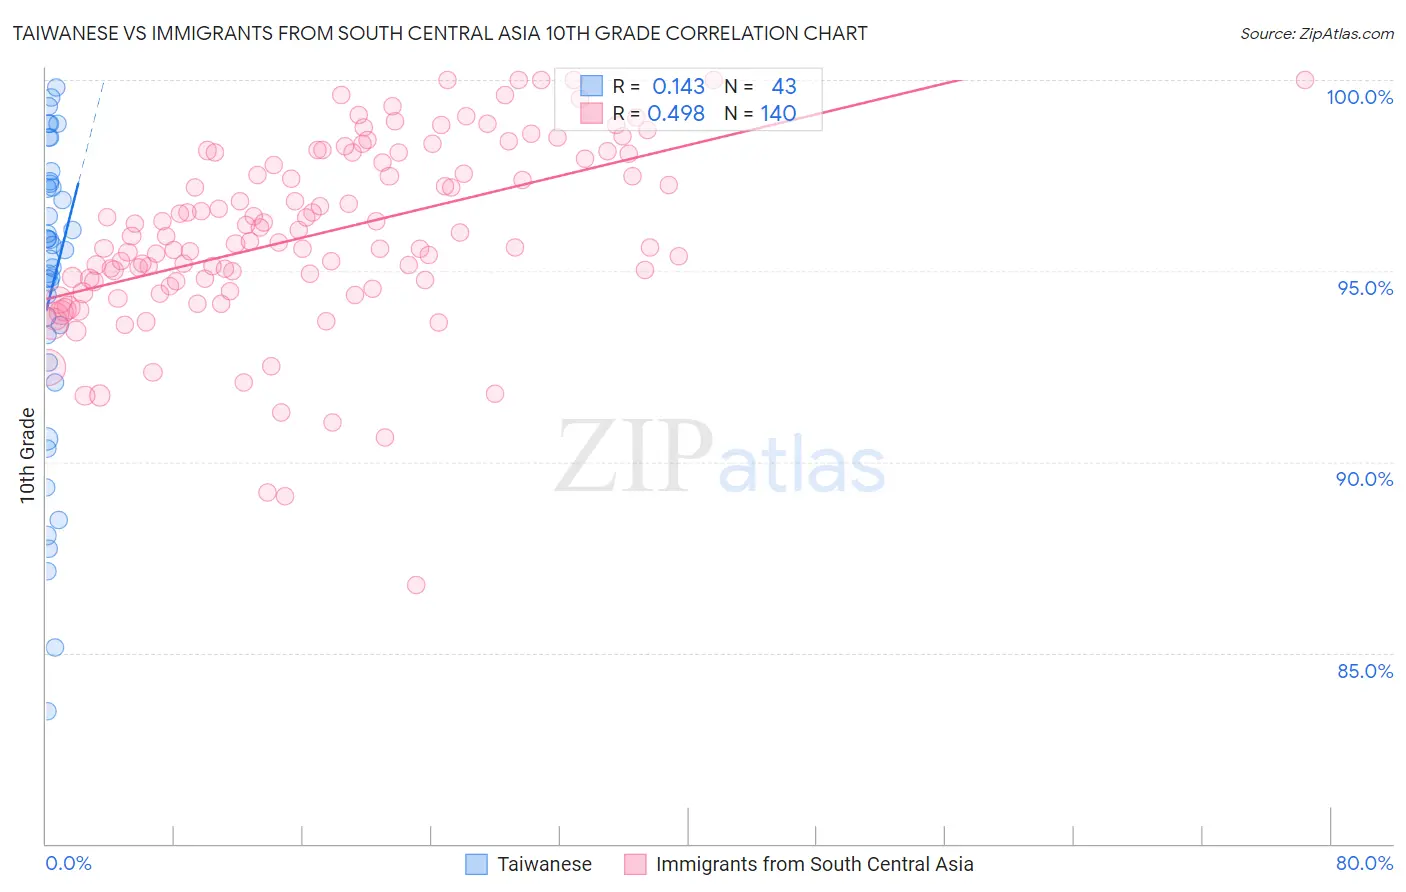
Taiwanese vs Immigrants from South Central Asia 10th Grade Correlation Chart

The statistical analysis conducted on geographies consisting of 31,677,387 people shows a poor positive correlation between the proportion of Taiwanese and percentage of population with at least 10th grade education in the United States with a correlation coefficient (R) of 0.143 and weighted average of 92.5%. Similarly, the statistical analysis conducted on geographies consisting of 473,113,181 people shows a moderate positive correlation between the proportion of Immigrants from South Central Asia and percentage of population with at least 10th grade education in the United States with a correlation coefficient (R) of 0.498 and weighted average of 94.5%, a difference of 2.1%.
Taiwanese vs Immigrants from South Central Asia 10th Grade

10th Grade Correlation Summary

MeasurementTaiwaneseImmigrants from South Central Asia
Minimum83.5%86.8%
Maximum99.8%100.0%
Range16.3%13.2%
Mean94.5%96.0%
Median95.6%95.8%
Interquartile 25% (IQ1)92.6%94.7%
Interquartile 75% (IQ3)97.3%98.0%
Interquartile Range (IQR)4.7%3.3%
Standard Deviation (Sample)4.0%2.4%
Standard Deviation (Population)4.0%2.4%

Similar Demographics by 10th Grade

Demographics Similar to Taiwanese by 10th Grade

In terms of 10th grade, the demographic groups most similar to Taiwanese are Immigrants from Ghana (92.5%, a difference of 0.0%), Dutch West Indian (92.6%, a difference of 0.010%), Immigrants from Philippines (92.6%, a difference of 0.010%), Immigrants from Colombia (92.5%, a difference of 0.020%), and Immigrants from Uruguay (92.5%, a difference of 0.020%).
DemographicsRating | Rank10th Grade
Immigrants | Uzbekistan
0.5
/100
|
#260
Tragic
92.6%
Paiute
0.4
/100
|
#261
Tragic
92.6%
Immigrants | South America
0.4
/100
|
#262
Tragic
92.6%
Apache
0.4
/100
|
#263
Tragic
92.6%
Peruvians
0.4
/100
|
#264
Tragic
92.6%
Dutch West Indians
0.4
/100
|
#265
Tragic
92.6%
Immigrants | Philippines
0.4
/100
|
#266
Tragic
92.6%
Taiwanese
0.3
/100
|
#267
Tragic
92.5%
Immigrants | Ghana
0.3
/100
|
#268
Tragic
92.5%
Immigrants | Colombia
0.3
/100
|
#269
Tragic
92.5%
Immigrants | Uruguay
0.3
/100
|
#270
Tragic
92.5%
Immigrants | Eritrea
0.3
/100
|
#271
Tragic
92.5%
Immigrants | Western Africa
0.3
/100
|
#272
Tragic
92.5%
Trinidadians and Tobagonians
0.2
/100
|
#273
Tragic
92.4%
Immigrants | Congo
0.2
/100
|
#274
Tragic
92.4%

Demographics Similar to Immigrants from South Central Asia by 10th Grade

In terms of 10th grade, the demographic groups most similar to Immigrants from South Central Asia are Syrian (94.5%, a difference of 0.0%), Cambodian (94.5%, a difference of 0.010%), Immigrants from France (94.5%, a difference of 0.020%), Immigrants from Bulgaria (94.6%, a difference of 0.030%), and Immigrants from Europe (94.5%, a difference of 0.030%).
DemographicsRating | Rank10th Grade
Soviet Union
98.3
/100
|
#93
Exceptional
94.6%
Immigrants | Germany
98.3
/100
|
#94
Exceptional
94.6%
Menominee
98.3
/100
|
#95
Exceptional
94.6%
Immigrants | Switzerland
98.3
/100
|
#96
Exceptional
94.6%
Lebanese
98.3
/100
|
#97
Exceptional
94.6%
Immigrants | Bulgaria
98.1
/100
|
#98
Exceptional
94.6%
Immigrants | France
97.9
/100
|
#99
Exceptional
94.5%
Immigrants | South Central Asia
97.8
/100
|
#100
Exceptional
94.5%
Syrians
97.7
/100
|
#101
Exceptional
94.5%
Cambodians
97.6
/100
|
#102
Exceptional
94.5%
Immigrants | Europe
97.5
/100
|
#103
Exceptional
94.5%
Immigrants | Romania
97.5
/100
|
#104
Exceptional
94.5%
Immigrants | Turkey
97.4
/100
|
#105
Exceptional
94.5%
Immigrants | Serbia
97.4
/100
|
#106
Exceptional
94.5%
Immigrants | Croatia
97.4
/100
|
#107
Exceptional
94.5%