Syrian vs Central American Indian 3rd Grade
COMPARE
Syrian
Central American Indian
3rd Grade
3rd Grade Comparison
Syrians
Central American Indians
98.0%
3RD GRADE
93.8/ 100
METRIC RATING
123rd/ 347
METRIC RANK
96.7%
3RD GRADE
0.0/ 100
METRIC RATING
305th/ 347
METRIC RANK
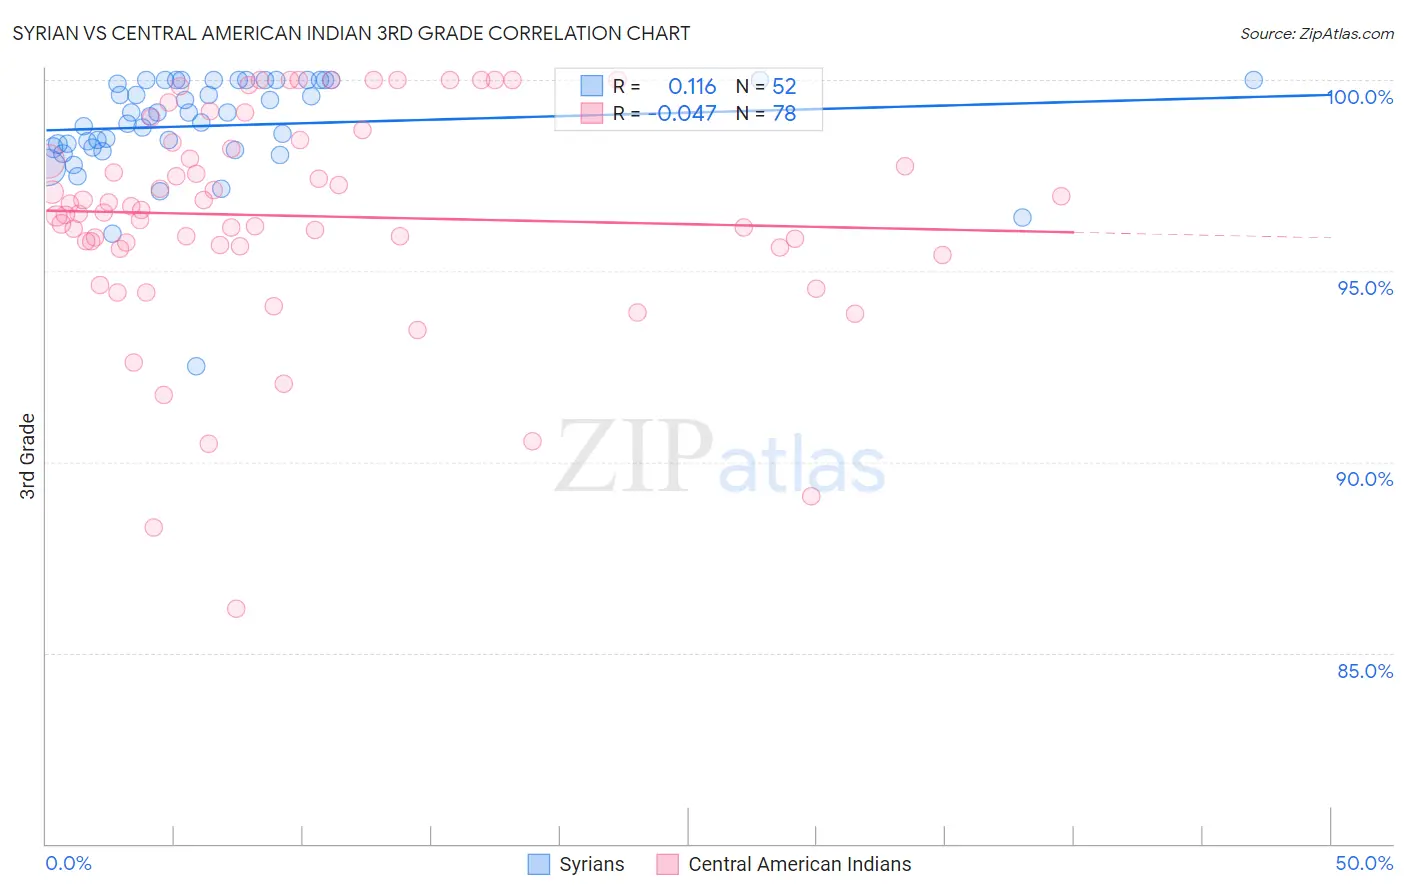
Syrian vs Central American Indian 3rd Grade Correlation Chart
The statistical analysis conducted on geographies consisting of 266,305,988 people shows a poor positive correlation between the proportion of Syrians and percentage of population with at least 3rd grade education in the United States with a correlation coefficient (R) of 0.116 and weighted average of 98.0%. Similarly, the statistical analysis conducted on geographies consisting of 326,141,205 people shows no correlation between the proportion of Central American Indians and percentage of population with at least 3rd grade education in the United States with a correlation coefficient (R) of -0.047 and weighted average of 96.7%, a difference of 1.3%.
3rd Grade Correlation Summary
| Measurement | Syrian | Central American Indian |
| Minimum | 92.5% | 86.2% |
| Maximum | 100.0% | 100.0% |
| Range | 7.5% | 13.8% |
| Mean | 98.8% | 96.4% |
| Median | 99.1% | 96.6% |
| Interquartile 25% (IQ1) | 98.2% | 95.6% |
| Interquartile 75% (IQ3) | 100.0% | 98.4% |
| Interquartile Range (IQR) | 1.8% | 2.7% |
| Standard Deviation (Sample) | 1.4% | 2.8% |
| Standard Deviation (Population) | 1.3% | 2.8% |
Similar Demographics by 3rd Grade
Demographics Similar to Syrians by 3rd Grade
In terms of 3rd grade, the demographic groups most similar to Syrians are Immigrants from Japan (98.0%, a difference of 0.0%), Immigrants from Saudi Arabia (98.0%, a difference of 0.0%), Immigrants from Croatia (98.0%, a difference of 0.010%), Iroquois (98.0%, a difference of 0.010%), and Lebanese (98.0%, a difference of 0.010%).
| Demographics | Rating | Rank | 3rd Grade |
| Immigrants | Norway | 95.2 /100 | #116 | Exceptional 98.0% |
| Immigrants | France | 95.1 /100 | #117 | Exceptional 98.0% |
| Iranians | 94.9 /100 | #118 | Exceptional 98.0% |
| Spanish | 94.8 /100 | #119 | Exceptional 98.0% |
| Immigrants | Croatia | 94.4 /100 | #120 | Exceptional 98.0% |
| Iroquois | 94.1 /100 | #121 | Exceptional 98.0% |
| Lebanese | 94.1 /100 | #122 | Exceptional 98.0% |
| Syrians | 93.8 /100 | #123 | Exceptional 98.0% |
| Immigrants | Japan | 93.7 /100 | #124 | Exceptional 98.0% |
| Immigrants | Saudi Arabia | 93.5 /100 | #125 | Exceptional 98.0% |
| Immigrants | Zimbabwe | 93.4 /100 | #126 | Exceptional 98.0% |
| Ute | 93.2 /100 | #127 | Exceptional 98.0% |
| Colville | 92.1 /100 | #128 | Exceptional 98.0% |
| Immigrants | Serbia | 91.9 /100 | #129 | Exceptional 98.0% |
| Immigrants | Europe | 91.2 /100 | #130 | Exceptional 98.0% |
Demographics Similar to Central American Indians by 3rd Grade
In terms of 3rd grade, the demographic groups most similar to Central American Indians are Immigrants from Caribbean (96.7%, a difference of 0.010%), Immigrants from Somalia (96.8%, a difference of 0.030%), Ecuadorian (96.7%, a difference of 0.030%), Guyanese (96.7%, a difference of 0.030%), and Nicaraguan (96.7%, a difference of 0.050%).
| Demographics | Rating | Rank | 3rd Grade |
| Immigrants | Dominica | 0.0 /100 | #298 | Tragic 96.9% |
| Somalis | 0.0 /100 | #299 | Tragic 96.8% |
| Immigrants | South Eastern Asia | 0.0 /100 | #300 | Tragic 96.8% |
| Immigrants | Cuba | 0.0 /100 | #301 | Tragic 96.8% |
| Immigrants | Somalia | 0.0 /100 | #302 | Tragic 96.8% |
| Ecuadorians | 0.0 /100 | #303 | Tragic 96.7% |
| Immigrants | Caribbean | 0.0 /100 | #304 | Tragic 96.7% |
| Central American Indians | 0.0 /100 | #305 | Tragic 96.7% |
| Guyanese | 0.0 /100 | #306 | Tragic 96.7% |
| Nicaraguans | 0.0 /100 | #307 | Tragic 96.7% |
| Immigrants | Haiti | 0.0 /100 | #308 | Tragic 96.7% |
| Sri Lankans | 0.0 /100 | #309 | Tragic 96.7% |
| Cape Verdeans | 0.0 /100 | #310 | Tragic 96.6% |
| Immigrants | Guyana | 0.0 /100 | #311 | Tragic 96.6% |
| Immigrants | Laos | 0.0 /100 | #312 | Tragic 96.6% |