Swiss vs Paraguayan 12th Grade, No Diploma

COMPARE

Swiss
Race
Ancestry
AfghanAfricanAlaska NativeAlaskan AthabascanAlbanianAleutAlsatianAmericanApacheArabArapahoArgentineanArmenianAssyrian/Chaldean/SyriacAustralianAustrianBahamianBangladeshiBarbadianBasqueBelgianBelizeanBermudanBhutaneseBlackfeetBolivianBrazilianBritishBritish West IndianBulgarianBurmeseCajunCambodianCanadianCape VerdeanCarpatho RusynCelticCentral AmericanCentral American IndianCherokeeCheyenneChickasawChileanChineseChippewaChoctawColombianColvilleComancheCosta RicanCreeCreekCroatianCrowCubanCypriotCzechCzechoslovakianDanishDelawareDominicanDutchDutch West IndianEastern EuropeanEcuadorianEgyptianEnglishEstonianEthiopianEuropeanFijianFilipinoFinnishFrenchFrench American IndianFrench CanadianGermanGerman RussianGhanaianGreekGuamanian/ChamorroGuatemalanGuyaneseHaitianHmongHonduranHopiHoumaHungarianIcelanderIndian (Asian)IndonesianInupiatIranianIraqiIrishIroquoisIsraeliItalianJamaicanJapaneseJordanianKenyanKiowaKoreanLaotianLatvianLebaneseLiberianLithuanianLumbeeLuxembourgerMacedonianMalaysianMalteseMarshalleseMenomineeMexicanMexican American IndianMongolianMoroccanNative HawaiianNavajoNepaleseNew ZealanderNicaraguanNigerianNorthern EuropeanNorwegianOkinawanOsageOttawaPaiutePakistaniPalestinianPanamanianPennsylvania GermanPeruvianPimaPolishPortuguesePotawatomiPuebloPuerto RicanPuget Sound SalishRomanianRussianSalvadoranSamoanScandinavianScotch-IrishScottishSeminoleSenegaleseSerbianShoshoneSierra LeoneanSiouxSlavicSlovakSloveneSomaliSouth AfricanSouth AmericanSouth American IndianSoviet UnionSpaniardSpanishSpanish AmericanSpanish American IndianSri LankanSubsaharan AfricanSudaneseSwedishSwissSyrianTaiwaneseThaiTlingit-HaidaTohono O'OdhamTonganTrinidadian and TobagonianTsimshianTurkishU.S. Virgin IslanderUgandanUkrainianUruguayanUteVenezuelanVietnameseWelshWest IndianYakamaYaquiYugoslavianYumanYup'ikZimbabwean
Immigration
NonimmigrantsImmigrantsAfghanistanAfricaAlbaniaArgentinaArmeniaAsiaAustraliaAustriaBahamasBangladeshBarbadosBelarusBelgiumBelizeBoliviaBosnia and HerzegovinaBrazilBulgariaBurma/MyanmarCabo VerdeCambodiaCameroonCanadaCaribbeanCentral AmericaChileChinaColombiaCongoCosta RicaCroatiaCubaCzechoslovakiaDenmarkDominicaDominican RepublicEastern AfricaEastern AsiaEastern EuropeEcuadorEgyptEl SalvadorEnglandEritreaEthiopiaEuropeFijiFranceGermanyGhanaGreeceGrenadaGuatemalaGuyanaHaitiHondurasHong KongHungaryIndiaIndonesiaIranIraqIrelandIsraelItalyJamaicaJapanJordanKazakhstanKenyaKoreaKuwaitLaosLatin AmericaLatviaLebanonLiberiaLithuaniaMalaysiaMexicoMicronesiaMiddle AfricaMoldovaMoroccoNepalNetherlandsNicaraguaNigeriaNorth AmericaNorth MacedoniaNorthern AfricaNorthern EuropeNorwayOceaniaPakistanPanamaPeruPhilippinesPolandPortugalRomaniaRussiaSaudi ArabiaScotlandSenegalSerbiaSierra LeoneSingaporeSomaliaSouth AfricaSouth AmericaSouth Central AsiaSouth Eastern AsiaSouthern EuropeSpainSri LankaSt. Vincent and the GrenadinesSudanSwedenSwitzerlandSyriaTaiwanThailandTrinidad and TobagoTurkeyUgandaUkraineUruguayUzbekistanVenezuelaVietnamWest IndiesWestern AfricaWestern AsiaWestern EuropeYemenZaireZimbabweAzores
Paraguayan
Race
Ancestry
AfghanAfricanAlaska NativeAlaskan AthabascanAlbanianAleutAlsatianAmericanApacheArabArapahoArgentineanArmenianAssyrian/Chaldean/SyriacAustralianAustrianBahamianBangladeshiBarbadianBasqueBelgianBelizeanBermudanBhutaneseBlackfeetBolivianBrazilianBritishBritish West IndianBulgarianBurmeseCajunCambodianCanadianCape VerdeanCarpatho RusynCelticCentral AmericanCentral American IndianCherokeeCheyenneChickasawChileanChineseChippewaChoctawColombianColvilleComancheCosta RicanCreeCreekCroatianCrowCubanCypriotCzechCzechoslovakianDanishDelawareDominicanDutchDutch West IndianEastern EuropeanEcuadorianEgyptianEnglishEstonianEthiopianEuropeanFijianFilipinoFinnishFrenchFrench American IndianFrench CanadianGermanGerman RussianGhanaianGreekGuamanian/ChamorroGuatemalanGuyaneseHaitianHmongHonduranHopiHoumaHungarianIcelanderIndian (Asian)IndonesianInupiatIranianIraqiIrishIroquoisIsraeliItalianJamaicanJapaneseJordanianKenyanKiowaKoreanLaotianLatvianLebaneseLiberianLithuanianLumbeeLuxembourgerMacedonianMalaysianMalteseMarshalleseMenomineeMexicanMexican American IndianMongolianMoroccanNative HawaiianNavajoNepaleseNew ZealanderNicaraguanNigerianNorthern EuropeanNorwegianOkinawanOsageOttawaPaiutePakistaniPalestinianPanamanianParaguayanPennsylvania GermanPeruvianPimaPolishPortuguesePotawatomiPuebloPuerto RicanPuget Sound SalishRomanianRussianSalvadoranSamoanScandinavianScotch-IrishScottishSeminoleSenegaleseSerbianShoshoneSierra LeoneanSiouxSlavicSlovakSloveneSomaliSouth AfricanSouth AmericanSouth American IndianSoviet UnionSpaniardSpanishSpanish AmericanSpanish American IndianSri LankanSubsaharan AfricanSudaneseSwedishSyrianTaiwaneseThaiTlingit-HaidaTohono O'OdhamTonganTrinidadian and TobagonianTsimshianTurkishU.S. Virgin IslanderUgandanUkrainianUruguayanUteVenezuelanVietnameseWelshWest IndianYakamaYaquiYugoslavianYumanYup'ikZimbabwean
Immigration
NonimmigrantsImmigrantsAfghanistanAfricaAlbaniaArgentinaArmeniaAsiaAustraliaAustriaBahamasBangladeshBarbadosBelarusBelgiumBelizeBoliviaBosnia and HerzegovinaBrazilBulgariaBurma/MyanmarCabo VerdeCambodiaCameroonCanadaCaribbeanCentral AmericaChileChinaColombiaCongoCosta RicaCroatiaCubaCzechoslovakiaDenmarkDominicaDominican RepublicEastern AfricaEastern AsiaEastern EuropeEcuadorEgyptEl SalvadorEnglandEritreaEthiopiaEuropeFijiFranceGermanyGhanaGreeceGrenadaGuatemalaGuyanaHaitiHondurasHong KongHungaryIndiaIndonesiaIranIraqIrelandIsraelItalyJamaicaJapanJordanKazakhstanKenyaKoreaKuwaitLaosLatin AmericaLatviaLebanonLiberiaLithuaniaMalaysiaMexicoMicronesiaMiddle AfricaMoldovaMoroccoNepalNetherlandsNicaraguaNigeriaNorth AmericaNorth MacedoniaNorthern AfricaNorthern EuropeNorwayOceaniaPakistanPanamaPeruPhilippinesPolandPortugalRomaniaRussiaSaudi ArabiaScotlandSenegalSerbiaSierra LeoneSingaporeSomaliaSouth AfricaSouth AmericaSouth Central AsiaSouth Eastern AsiaSouthern EuropeSpainSri LankaSt. Vincent and the GrenadinesSudanSwedenSwitzerlandSyriaTaiwanThailandTrinidad and TobagoTurkeyUgandaUkraineUruguayUzbekistanVenezuelaVietnamWest IndiesWestern AfricaWestern AsiaWestern EuropeYemenZaireZimbabweAzores
12th Grade, No Diploma
Income
Poverty
Unemployment
Labor Participation
Family Structure
Vehicle Availability
Education Level
Disability

12th Grade, No Diploma Comparison

Swiss

Paraguayans

Exceptional
Good
92.3%
12TH GRADE, NO DIPLOMA
98.1/ 100
METRIC RATING
101st/ 347
METRIC RANK
91.5%
12TH GRADE, NO DIPLOMA
78.9/ 100
METRIC RATING
150th/ 347
METRIC RANK

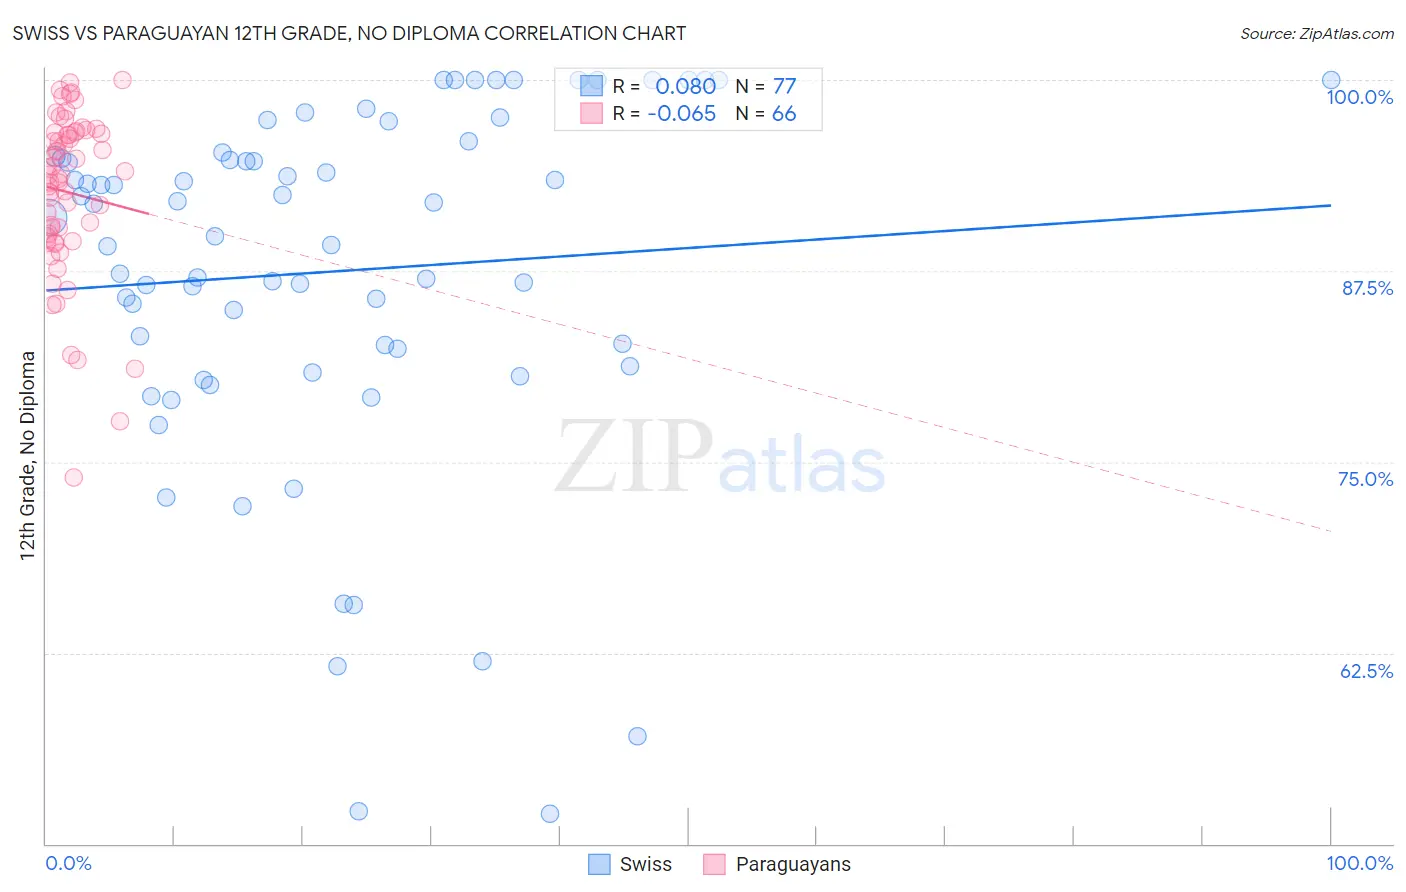
Swiss vs Paraguayan 12th Grade, No Diploma Correlation Chart

The statistical analysis conducted on geographies consisting of 465,013,678 people shows a slight positive correlation between the proportion of Swiss and percentage of population with at least 12th grade (no diploma) education in the United States with a correlation coefficient (R) of 0.080 and weighted average of 92.3%. Similarly, the statistical analysis conducted on geographies consisting of 95,114,201 people shows a slight negative correlation between the proportion of Paraguayans and percentage of population with at least 12th grade (no diploma) education in the United States with a correlation coefficient (R) of -0.065 and weighted average of 91.5%, a difference of 0.81%.
Swiss vs Paraguayan 12th Grade, No Diploma

12th Grade, No Diploma Correlation Summary

MeasurementSwissParaguayan
Minimum52.0%73.9%
Maximum100.0%100.0%
Range48.0%26.1%
Mean87.5%92.7%
Median91.0%93.8%
Interquartile 25% (IQ1)81.8%89.7%
Interquartile 75% (IQ3)95.1%96.6%
Interquartile Range (IQR)13.3%6.9%
Standard Deviation (Sample)11.6%5.4%
Standard Deviation (Population)11.6%5.4%

Similar Demographics by 12th Grade, No Diploma

Demographics Similar to Swiss by 12th Grade, No Diploma

In terms of 12th grade, no diploma, the demographic groups most similar to Swiss are Alaskan Athabascan (92.3%, a difference of 0.0%), Immigrants from Norway (92.3%, a difference of 0.010%), Immigrants from Croatia (92.3%, a difference of 0.020%), Immigrants from Korea (92.3%, a difference of 0.030%), and Celtic (92.3%, a difference of 0.050%).
DemographicsRating | Rank12th Grade, No Diploma
Immigrants | Europe
98.5
/100
|
#94
Exceptional
92.3%
Immigrants | North Macedonia
98.5
/100
|
#95
Exceptional
92.3%
Icelanders
98.5
/100
|
#96
Exceptional
92.3%
Celtics
98.4
/100
|
#97
Exceptional
92.3%
Immigrants | Kuwait
98.4
/100
|
#98
Exceptional
92.3%
Immigrants | Korea
98.3
/100
|
#99
Exceptional
92.3%
Immigrants | Croatia
98.3
/100
|
#100
Exceptional
92.3%
Swiss
98.1
/100
|
#101
Exceptional
92.3%
Alaskan Athabascans
98.1
/100
|
#102
Exceptional
92.3%
Immigrants | Norway
98.1
/100
|
#103
Exceptional
92.3%
Lebanese
97.6
/100
|
#104
Exceptional
92.2%
Immigrants | Belarus
97.4
/100
|
#105
Exceptional
92.2%
Immigrants | Russia
97.3
/100
|
#106
Exceptional
92.2%
Syrians
97.2
/100
|
#107
Exceptional
92.2%
Jordanians
97.2
/100
|
#108
Exceptional
92.2%

Demographics Similar to Paraguayans by 12th Grade, No Diploma

In terms of 12th grade, no diploma, the demographic groups most similar to Paraguayans are Ugandan (91.5%, a difference of 0.0%), Chippewa (91.5%, a difference of 0.0%), Pakistani (91.5%, a difference of 0.010%), Indian (Asian) (91.5%, a difference of 0.010%), and Immigrants from Spain (91.6%, a difference of 0.020%).
DemographicsRating | Rank12th Grade, No Diploma
Immigrants | Argentina
80.7
/100
|
#143
Excellent
91.6%
Immigrants | Spain
80.1
/100
|
#144
Excellent
91.6%
Immigrants | Lebanon
80.0
/100
|
#145
Excellent
91.6%
Immigrants | Brazil
79.8
/100
|
#146
Good
91.5%
Pakistanis
79.6
/100
|
#147
Good
91.5%
Indians (Asian)
79.4
/100
|
#148
Good
91.5%
Ugandans
79.0
/100
|
#149
Good
91.5%
Paraguayans
78.9
/100
|
#150
Good
91.5%
Chippewa
78.8
/100
|
#151
Good
91.5%
Kenyans
77.4
/100
|
#152
Good
91.5%
Iraqis
75.3
/100
|
#153
Good
91.5%
Immigrants | Kenya
73.9
/100
|
#154
Good
91.5%
Immigrants | Iraq
73.0
/100
|
#155
Good
91.4%
Asians
71.9
/100
|
#156
Good
91.4%
Immigrants | Pakistan
70.7
/100
|
#157
Good
91.4%