Swiss vs Czech 10th Grade
COMPARE
Swiss
Czech
10th Grade
10th Grade Comparison
Swiss
Czechs
94.7%
10TH GRADE
99.1/ 100
METRIC RATING
82nd/ 347
METRIC RANK
95.5%
10TH GRADE
100.0/ 100
METRIC RATING
23rd/ 347
METRIC RANK
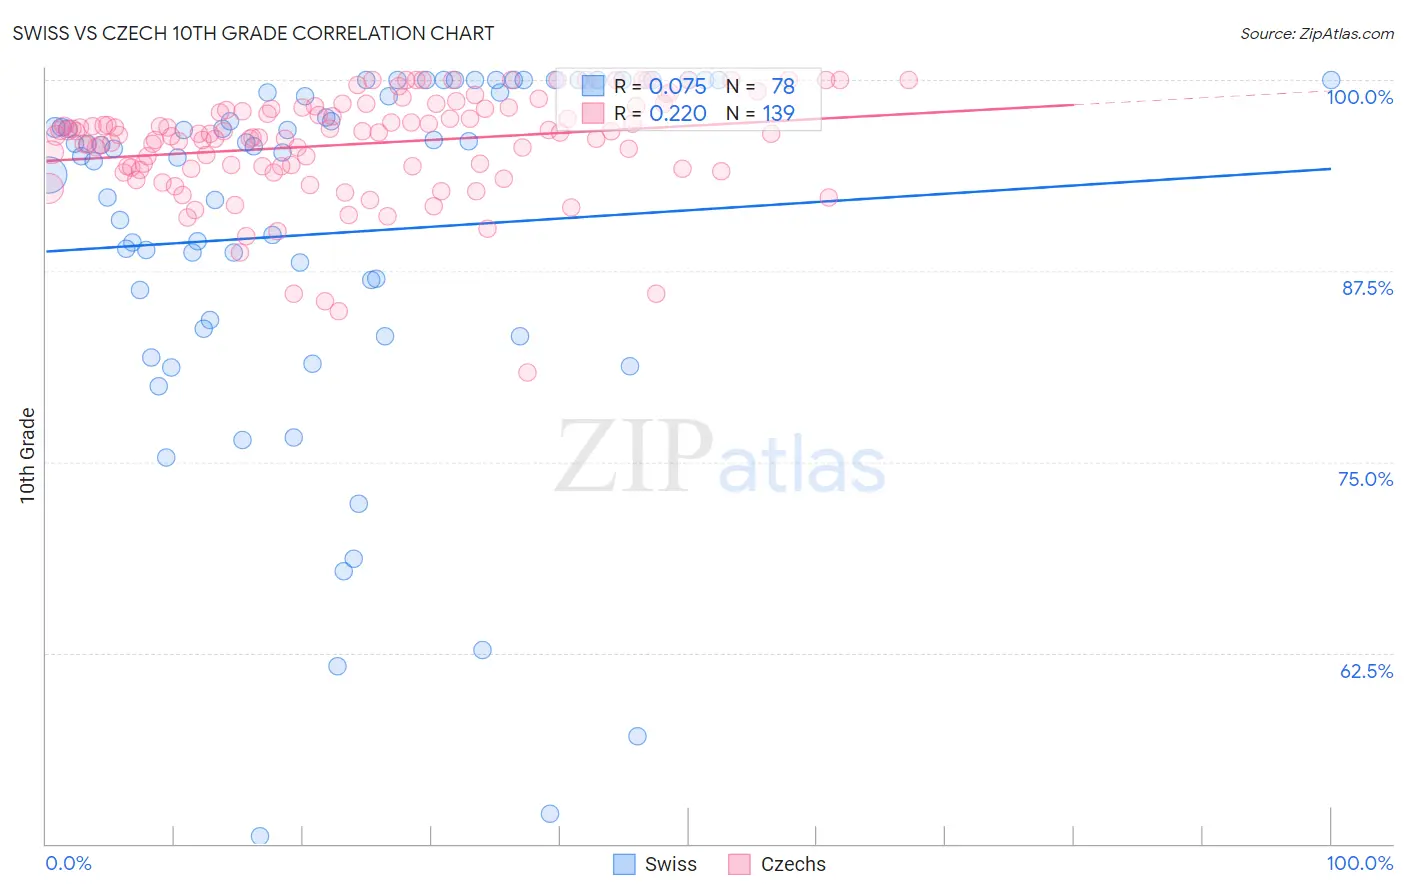
Swiss vs Czech 10th Grade Correlation Chart
The statistical analysis conducted on geographies consisting of 465,022,572 people shows a slight positive correlation between the proportion of Swiss and percentage of population with at least 10th grade education in the United States with a correlation coefficient (R) of 0.075 and weighted average of 94.7%. Similarly, the statistical analysis conducted on geographies consisting of 484,813,928 people shows a weak positive correlation between the proportion of Czechs and percentage of population with at least 10th grade education in the United States with a correlation coefficient (R) of 0.220 and weighted average of 95.5%, a difference of 0.81%.
10th Grade Correlation Summary
| Measurement | Swiss | Czech |
| Minimum | 50.5% | 80.9% |
| Maximum | 100.0% | 100.0% |
| Range | 49.5% | 19.1% |
| Mean | 90.0% | 95.8% |
| Median | 95.4% | 96.5% |
| Interquartile 25% (IQ1) | 84.3% | 94.3% |
| Interquartile 75% (IQ3) | 99.2% | 98.1% |
| Interquartile Range (IQR) | 14.9% | 3.9% |
| Standard Deviation (Sample) | 12.0% | 3.4% |
| Standard Deviation (Population) | 11.9% | 3.4% |
Similar Demographics by 10th Grade
Demographics Similar to Swiss by 10th Grade
In terms of 10th grade, the demographic groups most similar to Swiss are Immigrants from Western Europe (94.7%, a difference of 0.010%), Icelander (94.7%, a difference of 0.010%), Crow (94.7%, a difference of 0.020%), Puget Sound Salish (94.7%, a difference of 0.020%), and Immigrants from Denmark (94.7%, a difference of 0.030%).
| Demographics | Rating | Rank | 10th Grade |
| Okinawans | 99.5 /100 | #75 | Exceptional 94.8% |
| Romanians | 99.5 /100 | #76 | Exceptional 94.8% |
| Immigrants | South Africa | 99.5 /100 | #77 | Exceptional 94.8% |
| Filipinos | 99.3 /100 | #78 | Exceptional 94.8% |
| Immigrants | Czechoslovakia | 99.2 /100 | #79 | Exceptional 94.7% |
| Immigrants | Denmark | 99.2 /100 | #80 | Exceptional 94.7% |
| Immigrants | Latvia | 99.2 /100 | #81 | Exceptional 94.7% |
| Swiss | 99.1 /100 | #82 | Exceptional 94.7% |
| Immigrants | Western Europe | 99.1 /100 | #83 | Exceptional 94.7% |
| Icelanders | 99.1 /100 | #84 | Exceptional 94.7% |
| Crow | 99.0 /100 | #85 | Exceptional 94.7% |
| Puget Sound Salish | 99.0 /100 | #86 | Exceptional 94.7% |
| Immigrants | Saudi Arabia | 99.0 /100 | #87 | Exceptional 94.7% |
| Immigrants | Japan | 99.0 /100 | #88 | Exceptional 94.7% |
| Immigrants | Moldova | 98.9 /100 | #89 | Exceptional 94.7% |
Demographics Similar to Czechs by 10th Grade
In terms of 10th grade, the demographic groups most similar to Czechs are Eastern European (95.5%, a difference of 0.010%), European (95.5%, a difference of 0.010%), Maltese (95.5%, a difference of 0.020%), Welsh (95.5%, a difference of 0.030%), and Dutch (95.5%, a difference of 0.050%).
| Demographics | Rating | Rank | 10th Grade |
| Scottish | 100.0 /100 | #16 | Exceptional 95.6% |
| Latvians | 100.0 /100 | #17 | Exceptional 95.6% |
| Italians | 100.0 /100 | #18 | Exceptional 95.6% |
| Scandinavians | 100.0 /100 | #19 | Exceptional 95.6% |
| Chinese | 100.0 /100 | #20 | Exceptional 95.5% |
| Dutch | 100.0 /100 | #21 | Exceptional 95.5% |
| Eastern Europeans | 100.0 /100 | #22 | Exceptional 95.5% |
| Czechs | 100.0 /100 | #23 | Exceptional 95.5% |
| Europeans | 100.0 /100 | #24 | Exceptional 95.5% |
| Maltese | 100.0 /100 | #25 | Exceptional 95.5% |
| Welsh | 100.0 /100 | #26 | Exceptional 95.5% |
| Alaskan Athabascans | 100.0 /100 | #27 | Exceptional 95.4% |
| Luxembourgers | 100.0 /100 | #28 | Exceptional 95.4% |
| Bulgarians | 100.0 /100 | #29 | Exceptional 95.4% |
| Belgians | 100.0 /100 | #30 | Exceptional 95.4% |