Swiss vs Belgian Doctorate Degree

COMPARE

Swiss
Race
Ancestry
AfghanAfricanAlaska NativeAlaskan AthabascanAlbanianAleutAlsatianAmericanApacheArabArapahoArgentineanArmenianAssyrian/Chaldean/SyriacAustralianAustrianBahamianBangladeshiBarbadianBasqueBelizeanBermudanBhutaneseBlackfeetBolivianBrazilianBritishBritish West IndianBulgarianBurmeseCajunCambodianCanadianCape VerdeanCarpatho RusynCelticCentral AmericanCentral American IndianCherokeeCheyenneChickasawChileanChineseChippewaChoctawColombianColvilleComancheCosta RicanCreeCreekCroatianCrowCubanCypriotCzechCzechoslovakianDanishDelawareDominicanDutchDutch West IndianEastern EuropeanEcuadorianEgyptianEnglishEstonianEthiopianEuropeanFijianFilipinoFinnishFrenchFrench American IndianFrench CanadianGermanGerman RussianGhanaianGreekGuamanian/ChamorroGuatemalanGuyaneseHaitianHmongHonduranHopiHoumaHungarianIcelanderIndian (Asian)IndonesianInupiatIranianIraqiIrishIroquoisIsraeliItalianJamaicanJapaneseJordanianKenyanKiowaKoreanLaotianLatvianLebaneseLiberianLithuanianLumbeeLuxembourgerMacedonianMalaysianMalteseMarshalleseMenomineeMexicanMexican American IndianMongolianMoroccanNative HawaiianNavajoNepaleseNew ZealanderNicaraguanNigerianNorthern EuropeanNorwegianOkinawanOsageOttawaPaiutePakistaniPalestinianPanamanianParaguayanPennsylvania GermanPeruvianPimaPolishPortuguesePotawatomiPuebloPuerto RicanPuget Sound SalishRomanianRussianSalvadoranSamoanScandinavianScotch-IrishScottishSeminoleSenegaleseSerbianShoshoneSierra LeoneanSiouxSlavicSlovakSloveneSomaliSouth AfricanSouth AmericanSouth American IndianSoviet UnionSpaniardSpanishSpanish AmericanSpanish American IndianSri LankanSubsaharan AfricanSudaneseSwedishSwissSyrianTaiwaneseThaiTlingit-HaidaTohono O'OdhamTonganTrinidadian and TobagonianTsimshianTurkishU.S. Virgin IslanderUgandanUkrainianUruguayanUteVenezuelanVietnameseWelshWest IndianYakamaYaquiYugoslavianYumanYup'ikZimbabwean
Immigration
NonimmigrantsImmigrantsAfghanistanAfricaAlbaniaArgentinaArmeniaAsiaAustraliaAustriaBahamasBangladeshBarbadosBelarusBelgiumBelizeBoliviaBosnia and HerzegovinaBrazilBulgariaBurma/MyanmarCabo VerdeCambodiaCameroonCanadaCaribbeanCentral AmericaChileChinaColombiaCongoCosta RicaCroatiaCubaCzechoslovakiaDenmarkDominicaDominican RepublicEastern AfricaEastern AsiaEastern EuropeEcuadorEgyptEl SalvadorEnglandEritreaEthiopiaEuropeFijiFranceGermanyGhanaGreeceGrenadaGuatemalaGuyanaHaitiHondurasHong KongHungaryIndiaIndonesiaIranIraqIrelandIsraelItalyJamaicaJapanJordanKazakhstanKenyaKoreaKuwaitLaosLatin AmericaLatviaLebanonLiberiaLithuaniaMalaysiaMexicoMicronesiaMiddle AfricaMoldovaMoroccoNepalNetherlandsNicaraguaNigeriaNorth AmericaNorth MacedoniaNorthern AfricaNorthern EuropeNorwayOceaniaPakistanPanamaPeruPhilippinesPolandPortugalRomaniaRussiaSaudi ArabiaScotlandSenegalSerbiaSierra LeoneSingaporeSomaliaSouth AfricaSouth AmericaSouth Central AsiaSouth Eastern AsiaSouthern EuropeSpainSri LankaSt. Vincent and the GrenadinesSudanSwedenSwitzerlandSyriaTaiwanThailandTrinidad and TobagoTurkeyUgandaUkraineUruguayUzbekistanVenezuelaVietnamWest IndiesWestern AfricaWestern AsiaWestern EuropeYemenZaireZimbabweAzores
Belgian
Race
Ancestry
AfghanAfricanAlaska NativeAlaskan AthabascanAlbanianAleutAlsatianAmericanApacheArabArapahoArgentineanArmenianAssyrian/Chaldean/SyriacAustralianAustrianBahamianBangladeshiBarbadianBasqueBelgianBelizeanBermudanBhutaneseBlackfeetBolivianBrazilianBritishBritish West IndianBulgarianBurmeseCajunCambodianCanadianCape VerdeanCarpatho RusynCelticCentral AmericanCentral American IndianCherokeeCheyenneChickasawChileanChineseChippewaChoctawColombianColvilleComancheCosta RicanCreeCreekCroatianCrowCubanCypriotCzechCzechoslovakianDanishDelawareDominicanDutchDutch West IndianEastern EuropeanEcuadorianEgyptianEnglishEstonianEthiopianEuropeanFijianFilipinoFinnishFrenchFrench American IndianFrench CanadianGermanGerman RussianGhanaianGreekGuamanian/ChamorroGuatemalanGuyaneseHaitianHmongHonduranHopiHoumaHungarianIcelanderIndian (Asian)IndonesianInupiatIranianIraqiIrishIroquoisIsraeliItalianJamaicanJapaneseJordanianKenyanKiowaKoreanLaotianLatvianLebaneseLiberianLithuanianLumbeeLuxembourgerMacedonianMalaysianMalteseMarshalleseMenomineeMexicanMexican American IndianMongolianMoroccanNative HawaiianNavajoNepaleseNew ZealanderNicaraguanNigerianNorthern EuropeanNorwegianOkinawanOsageOttawaPaiutePakistaniPalestinianPanamanianParaguayanPennsylvania GermanPeruvianPimaPolishPortuguesePotawatomiPuebloPuerto RicanPuget Sound SalishRomanianRussianSalvadoranSamoanScandinavianScotch-IrishScottishSeminoleSenegaleseSerbianShoshoneSierra LeoneanSiouxSlavicSlovakSloveneSomaliSouth AfricanSouth AmericanSouth American IndianSoviet UnionSpaniardSpanishSpanish AmericanSpanish American IndianSri LankanSubsaharan AfricanSudaneseSwedishSyrianTaiwaneseThaiTlingit-HaidaTohono O'OdhamTonganTrinidadian and TobagonianTsimshianTurkishU.S. Virgin IslanderUgandanUkrainianUruguayanUteVenezuelanVietnameseWelshWest IndianYakamaYaquiYugoslavianYumanYup'ikZimbabwean
Immigration
NonimmigrantsImmigrantsAfghanistanAfricaAlbaniaArgentinaArmeniaAsiaAustraliaAustriaBahamasBangladeshBarbadosBelarusBelgiumBelizeBoliviaBosnia and HerzegovinaBrazilBulgariaBurma/MyanmarCabo VerdeCambodiaCameroonCanadaCaribbeanCentral AmericaChileChinaColombiaCongoCosta RicaCroatiaCubaCzechoslovakiaDenmarkDominicaDominican RepublicEastern AfricaEastern AsiaEastern EuropeEcuadorEgyptEl SalvadorEnglandEritreaEthiopiaEuropeFijiFranceGermanyGhanaGreeceGrenadaGuatemalaGuyanaHaitiHondurasHong KongHungaryIndiaIndonesiaIranIraqIrelandIsraelItalyJamaicaJapanJordanKazakhstanKenyaKoreaKuwaitLaosLatin AmericaLatviaLebanonLiberiaLithuaniaMalaysiaMexicoMicronesiaMiddle AfricaMoldovaMoroccoNepalNetherlandsNicaraguaNigeriaNorth AmericaNorth MacedoniaNorthern AfricaNorthern EuropeNorwayOceaniaPakistanPanamaPeruPhilippinesPolandPortugalRomaniaRussiaSaudi ArabiaScotlandSenegalSerbiaSierra LeoneSingaporeSomaliaSouth AfricaSouth AmericaSouth Central AsiaSouth Eastern AsiaSouthern EuropeSpainSri LankaSt. Vincent and the GrenadinesSudanSwedenSwitzerlandSyriaTaiwanThailandTrinidad and TobagoTurkeyUgandaUkraineUruguayUzbekistanVenezuelaVietnamWest IndiesWestern AfricaWestern AsiaWestern EuropeYemenZaireZimbabweAzores
Doctorate Degree
Income
Poverty
Unemployment
Labor Participation
Family Structure
Vehicle Availability
Education Level
Disability

Doctorate Degree Comparison

Swiss

Belgians

Excellent
Average
2.0%
DOCTORATE DEGREE
88.0/ 100
METRIC RATING
138th/ 347
METRIC RANK
1.8%
DOCTORATE DEGREE
50.3/ 100
METRIC RATING
172nd/ 347
METRIC RANK

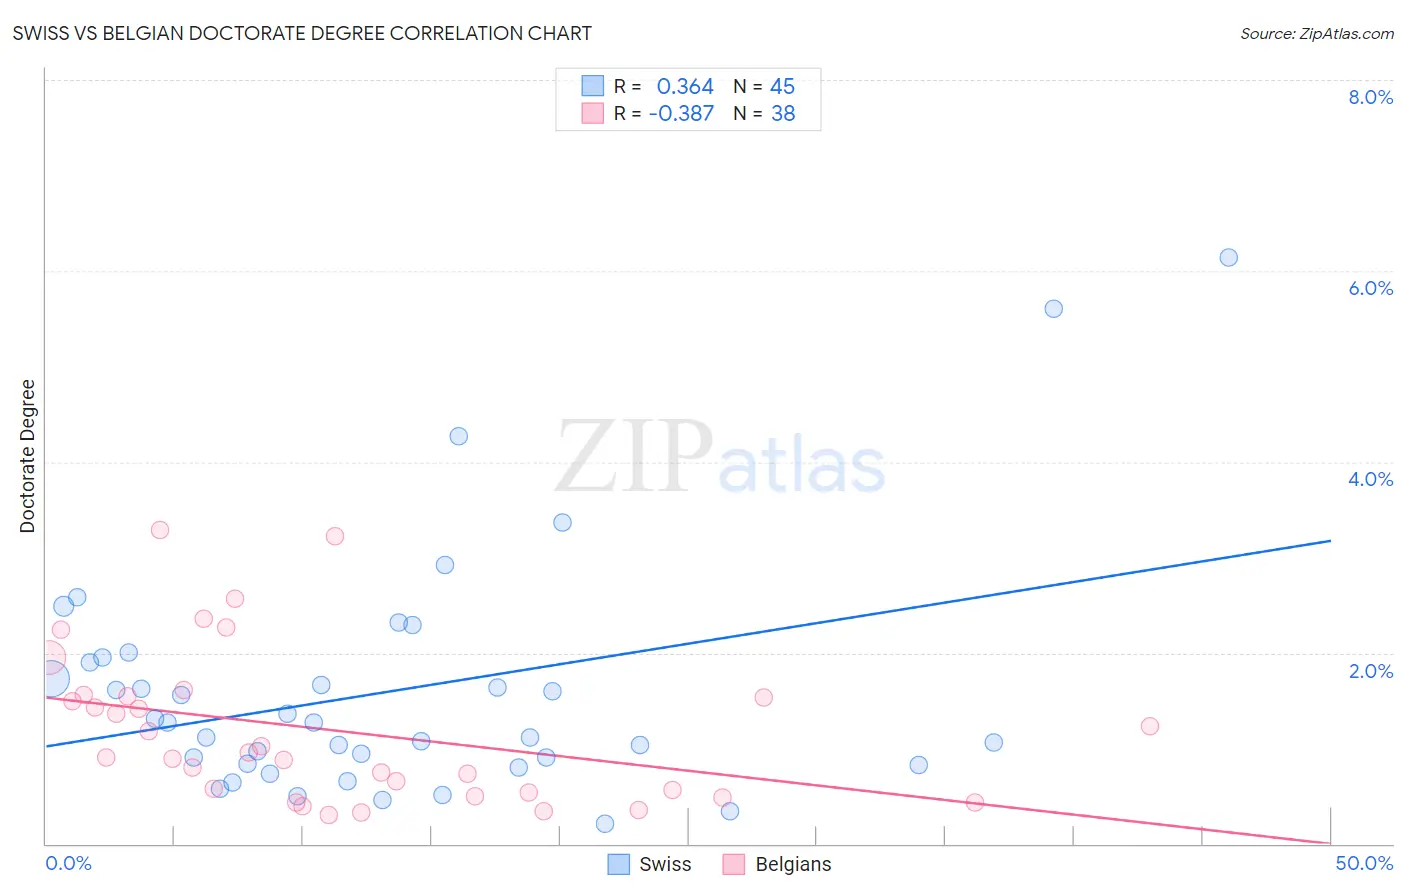
Swiss vs Belgian Doctorate Degree Correlation Chart

The statistical analysis conducted on geographies consisting of 455,851,671 people shows a mild positive correlation between the proportion of Swiss and percentage of population with at least doctorate degree education in the United States with a correlation coefficient (R) of 0.364 and weighted average of 2.0%. Similarly, the statistical analysis conducted on geographies consisting of 351,946,706 people shows a mild negative correlation between the proportion of Belgians and percentage of population with at least doctorate degree education in the United States with a correlation coefficient (R) of -0.387 and weighted average of 1.8%, a difference of 7.2%.
Swiss vs Belgian Doctorate Degree

Doctorate Degree Correlation Summary

MeasurementSwissBelgian
Minimum0.21%0.30%
Maximum6.1%3.3%
Range5.9%3.0%
Mean1.6%1.2%
Median1.3%0.93%
Interquartile 25% (IQ1)0.84%0.53%
Interquartile 75% (IQ3)1.9%1.5%
Interquartile Range (IQR)1.1%1.0%
Standard Deviation (Sample)1.2%0.80%
Standard Deviation (Population)1.2%0.79%

Similar Demographics by Doctorate Degree

Demographics Similar to Swiss by Doctorate Degree

In terms of doctorate degree, the demographic groups most similar to Swiss are South American Indian (2.0%, a difference of 0.090%), Swedish (2.0%, a difference of 0.10%), Afghan (2.0%, a difference of 0.23%), Serbian (2.0%, a difference of 0.24%), and Immigrants from Cameroon (2.0%, a difference of 0.30%).
DemographicsRating | RankDoctorate Degree
Immigrants | Sierra Leone
90.2
/100
|
#131
Exceptional
2.0%
Scottish
89.4
/100
|
#132
Excellent
2.0%
Immigrants | Uzbekistan
89.3
/100
|
#133
Excellent
2.0%
Immigrants | Cameroon
88.9
/100
|
#134
Excellent
2.0%
Serbians
88.7
/100
|
#135
Excellent
2.0%
Swedes
88.3
/100
|
#136
Excellent
2.0%
South American Indians
88.3
/100
|
#137
Excellent
2.0%
Swiss
88.0
/100
|
#138
Excellent
2.0%
Afghans
87.2
/100
|
#139
Excellent
2.0%
Immigrants | Africa
87.0
/100
|
#140
Excellent
2.0%
Senegalese
86.7
/100
|
#141
Excellent
2.0%
Italians
86.0
/100
|
#142
Excellent
2.0%
Sierra Leoneans
85.1
/100
|
#143
Excellent
2.0%
Immigrants | Moldova
84.3
/100
|
#144
Excellent
2.0%
Kenyans
83.6
/100
|
#145
Excellent
1.9%

Demographics Similar to Belgians by Doctorate Degree

In terms of doctorate degree, the demographic groups most similar to Belgians are Norwegian (1.8%, a difference of 0.040%), Immigrants from Bangladesh (1.8%, a difference of 0.040%), Immigrants from Thailand (1.8%, a difference of 0.12%), Spanish (1.8%, a difference of 0.14%), and Iraqi (1.8%, a difference of 0.15%).
DemographicsRating | RankDoctorate Degree
Scotch-Irish
63.6
/100
|
#165
Good
1.9%
Spaniards
63.5
/100
|
#166
Good
1.9%
Macedonians
60.9
/100
|
#167
Good
1.9%
Sri Lankans
60.3
/100
|
#168
Good
1.9%
Vietnamese
54.8
/100
|
#169
Average
1.9%
Costa Ricans
53.3
/100
|
#170
Average
1.8%
Bermudans
52.1
/100
|
#171
Average
1.8%
Belgians
50.3
/100
|
#172
Average
1.8%
Norwegians
50.0
/100
|
#173
Average
1.8%
Immigrants | Bangladesh
50.0
/100
|
#174
Average
1.8%
Immigrants | Thailand
49.4
/100
|
#175
Average
1.8%
Spanish
49.3
/100
|
#176
Average
1.8%
Iraqis
49.2
/100
|
#177
Average
1.8%
French
48.8
/100
|
#178
Average
1.8%
Ghanaians
48.3
/100
|
#179
Average
1.8%