Subsaharan African vs Latvian 3rd Grade

COMPARE

Subsaharan African
Race
Ancestry
AfghanAfricanAlaska NativeAlaskan AthabascanAlbanianAleutAlsatianAmericanApacheArabArapahoArgentineanArmenianAssyrian/Chaldean/SyriacAustralianAustrianBahamianBangladeshiBarbadianBasqueBelgianBelizeanBermudanBhutaneseBlackfeetBolivianBrazilianBritishBritish West IndianBulgarianBurmeseCajunCambodianCanadianCape VerdeanCarpatho RusynCelticCentral AmericanCentral American IndianCherokeeCheyenneChickasawChileanChineseChippewaChoctawColombianColvilleComancheCosta RicanCreeCreekCroatianCrowCubanCypriotCzechCzechoslovakianDanishDelawareDominicanDutchDutch West IndianEastern EuropeanEcuadorianEgyptianEnglishEstonianEthiopianEuropeanFijianFilipinoFinnishFrenchFrench American IndianFrench CanadianGermanGerman RussianGhanaianGreekGuamanian/ChamorroGuatemalanGuyaneseHaitianHmongHonduranHopiHoumaHungarianIcelanderIndian (Asian)IndonesianInupiatIranianIraqiIrishIroquoisIsraeliItalianJamaicanJapaneseJordanianKenyanKiowaKoreanLaotianLebaneseLiberianLithuanianLumbeeLuxembourgerMacedonianMalaysianMalteseMarshalleseMenomineeMexicanMexican American IndianMongolianMoroccanNative HawaiianNavajoNepaleseNew ZealanderNicaraguanNigerianNorthern EuropeanNorwegianOkinawanOsageOttawaPaiutePakistaniPalestinianPanamanianParaguayanPennsylvania GermanPeruvianPimaPolishPortuguesePotawatomiPuebloPuerto RicanPuget Sound SalishRomanianRussianSalvadoranSamoanScandinavianScotch-IrishScottishSeminoleSenegaleseSerbianShoshoneSierra LeoneanSiouxSlavicSlovakSloveneSomaliSouth AfricanSouth AmericanSouth American IndianSoviet UnionSpaniardSpanishSpanish AmericanSpanish American IndianSri LankanSubsaharan AfricanSudaneseSwedishSwissSyrianTaiwaneseThaiTlingit-HaidaTohono O'OdhamTonganTrinidadian and TobagonianTsimshianTurkishU.S. Virgin IslanderUgandanUkrainianUruguayanUteVenezuelanVietnameseWelshWest IndianYakamaYaquiYugoslavianYumanYup'ikZimbabwean
Immigration
NonimmigrantsImmigrantsAfghanistanAfricaAlbaniaArgentinaArmeniaAsiaAustraliaAustriaBahamasBangladeshBarbadosBelarusBelgiumBelizeBoliviaBosnia and HerzegovinaBrazilBulgariaBurma/MyanmarCabo VerdeCambodiaCameroonCanadaCaribbeanCentral AmericaChileChinaColombiaCongoCosta RicaCroatiaCubaCzechoslovakiaDenmarkDominicaDominican RepublicEastern AfricaEastern AsiaEastern EuropeEcuadorEgyptEl SalvadorEnglandEritreaEthiopiaEuropeFijiFranceGermanyGhanaGreeceGrenadaGuatemalaGuyanaHaitiHondurasHong KongHungaryIndiaIndonesiaIranIraqIrelandIsraelItalyJamaicaJapanJordanKazakhstanKenyaKoreaKuwaitLaosLatin AmericaLatviaLebanonLiberiaLithuaniaMalaysiaMexicoMicronesiaMiddle AfricaMoldovaMoroccoNepalNetherlandsNicaraguaNigeriaNorth AmericaNorth MacedoniaNorthern AfricaNorthern EuropeNorwayOceaniaPakistanPanamaPeruPhilippinesPolandPortugalRomaniaRussiaSaudi ArabiaScotlandSenegalSerbiaSierra LeoneSingaporeSomaliaSouth AfricaSouth AmericaSouth Central AsiaSouth Eastern AsiaSouthern EuropeSpainSri LankaSt. Vincent and the GrenadinesSudanSwedenSwitzerlandSyriaTaiwanThailandTrinidad and TobagoTurkeyUgandaUkraineUruguayUzbekistanVenezuelaVietnamWest IndiesWestern AfricaWestern AsiaWestern EuropeYemenZaireZimbabweAzores
Latvian
Race
Ancestry
AfghanAfricanAlaska NativeAlaskan AthabascanAlbanianAleutAlsatianAmericanApacheArabArapahoArgentineanArmenianAssyrian/Chaldean/SyriacAustralianAustrianBahamianBangladeshiBarbadianBasqueBelgianBelizeanBermudanBhutaneseBlackfeetBolivianBrazilianBritishBritish West IndianBulgarianBurmeseCajunCambodianCanadianCape VerdeanCarpatho RusynCelticCentral AmericanCentral American IndianCherokeeCheyenneChickasawChileanChineseChippewaChoctawColombianColvilleComancheCosta RicanCreeCreekCroatianCrowCubanCypriotCzechCzechoslovakianDanishDelawareDominicanDutchDutch West IndianEastern EuropeanEcuadorianEgyptianEnglishEstonianEthiopianEuropeanFijianFilipinoFinnishFrenchFrench American IndianFrench CanadianGermanGerman RussianGhanaianGreekGuamanian/ChamorroGuatemalanGuyaneseHaitianHmongHonduranHopiHoumaHungarianIcelanderIndian (Asian)IndonesianInupiatIranianIraqiIrishIroquoisIsraeliItalianJamaicanJapaneseJordanianKenyanKiowaKoreanLaotianLatvianLebaneseLiberianLithuanianLumbeeLuxembourgerMacedonianMalaysianMalteseMarshalleseMenomineeMexicanMexican American IndianMongolianMoroccanNative HawaiianNavajoNepaleseNew ZealanderNicaraguanNigerianNorthern EuropeanNorwegianOkinawanOsageOttawaPaiutePakistaniPalestinianPanamanianParaguayanPennsylvania GermanPeruvianPimaPolishPortuguesePotawatomiPuebloPuerto RicanPuget Sound SalishRomanianRussianSalvadoranSamoanScandinavianScotch-IrishScottishSeminoleSenegaleseSerbianShoshoneSierra LeoneanSiouxSlavicSlovakSloveneSomaliSouth AfricanSouth AmericanSouth American IndianSoviet UnionSpaniardSpanishSpanish AmericanSpanish American IndianSri LankanSudaneseSwedishSwissSyrianTaiwaneseThaiTlingit-HaidaTohono O'OdhamTonganTrinidadian and TobagonianTsimshianTurkishU.S. Virgin IslanderUgandanUkrainianUruguayanUteVenezuelanVietnameseWelshWest IndianYakamaYaquiYugoslavianYumanYup'ikZimbabwean
Immigration
NonimmigrantsImmigrantsAfghanistanAfricaAlbaniaArgentinaArmeniaAsiaAustraliaAustriaBahamasBangladeshBarbadosBelarusBelgiumBelizeBoliviaBosnia and HerzegovinaBrazilBulgariaBurma/MyanmarCabo VerdeCambodiaCameroonCanadaCaribbeanCentral AmericaChileChinaColombiaCongoCosta RicaCroatiaCubaCzechoslovakiaDenmarkDominicaDominican RepublicEastern AfricaEastern AsiaEastern EuropeEcuadorEgyptEl SalvadorEnglandEritreaEthiopiaEuropeFijiFranceGermanyGhanaGreeceGrenadaGuatemalaGuyanaHaitiHondurasHong KongHungaryIndiaIndonesiaIranIraqIrelandIsraelItalyJamaicaJapanJordanKazakhstanKenyaKoreaKuwaitLaosLatin AmericaLatviaLebanonLiberiaLithuaniaMalaysiaMexicoMicronesiaMiddle AfricaMoldovaMoroccoNepalNetherlandsNicaraguaNigeriaNorth AmericaNorth MacedoniaNorthern AfricaNorthern EuropeNorwayOceaniaPakistanPanamaPeruPhilippinesPolandPortugalRomaniaRussiaSaudi ArabiaScotlandSenegalSerbiaSierra LeoneSingaporeSomaliaSouth AfricaSouth AmericaSouth Central AsiaSouth Eastern AsiaSouthern EuropeSpainSri LankaSt. Vincent and the GrenadinesSudanSwedenSwitzerlandSyriaTaiwanThailandTrinidad and TobagoTurkeyUgandaUkraineUruguayUzbekistanVenezuelaVietnamWest IndiesWestern AfricaWestern AsiaWestern EuropeYemenZaireZimbabweAzores
3rd Grade
Income
Poverty
Unemployment
Labor Participation
Family Structure
Vehicle Availability
Education Level
Disability

3rd Grade Comparison

Sub-Saharan Africans

Latvians

Tragic
Exceptional
97.5%
3RD GRADE
3.2/ 100
METRIC RATING
228th/ 347
METRIC RANK
98.4%
3RD GRADE
99.9/ 100
METRIC RATING
39th/ 347
METRIC RANK

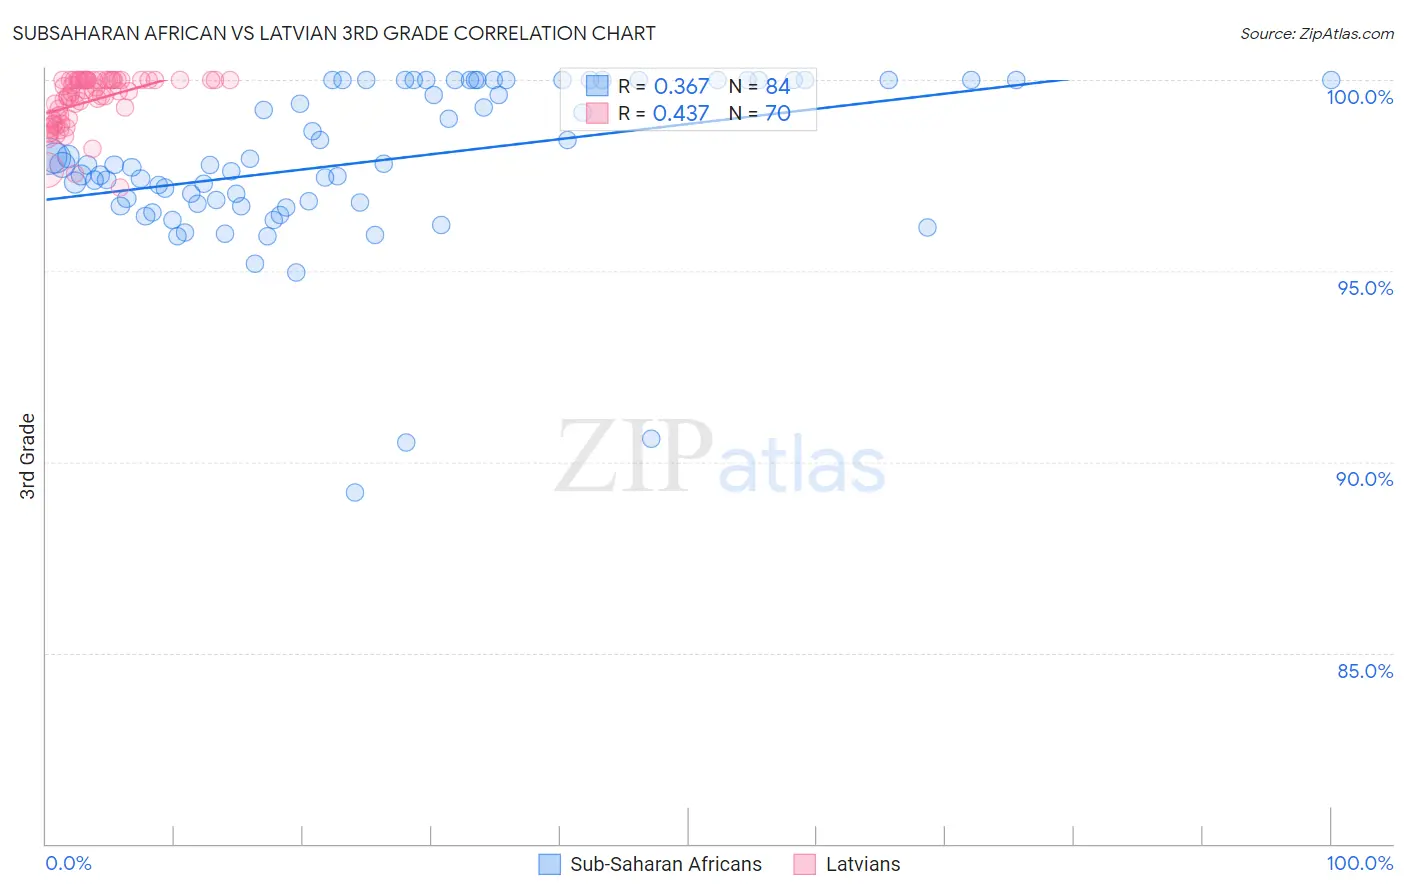
Subsaharan African vs Latvian 3rd Grade Correlation Chart

The statistical analysis conducted on geographies consisting of 508,209,936 people shows a mild positive correlation between the proportion of Sub-Saharan Africans and percentage of population with at least 3rd grade education in the United States with a correlation coefficient (R) of 0.367 and weighted average of 97.5%. Similarly, the statistical analysis conducted on geographies consisting of 220,726,452 people shows a moderate positive correlation between the proportion of Latvians and percentage of population with at least 3rd grade education in the United States with a correlation coefficient (R) of 0.437 and weighted average of 98.4%, a difference of 0.91%.
Subsaharan African vs Latvian 3rd Grade

3rd Grade Correlation Summary

MeasurementSubsaharan AfricanLatvian
Minimum89.2%97.2%
Maximum100.0%100.0%
Range10.8%2.8%
Mean97.9%99.4%
Median97.8%99.7%
Interquartile 25% (IQ1)96.8%99.0%
Interquartile 75% (IQ3)100.0%100.0%
Interquartile Range (IQR)3.2%1.0%
Standard Deviation (Sample)2.1%0.67%
Standard Deviation (Population)2.1%0.67%

Similar Demographics by 3rd Grade

Demographics Similar to Sub-Saharan Africans by 3rd Grade

In terms of 3rd grade, the demographic groups most similar to Sub-Saharan Africans are Immigrants from Sudan (97.5%, a difference of 0.010%), Senegalese (97.5%, a difference of 0.010%), Immigrants from Pakistan (97.5%, a difference of 0.010%), Immigrants from Costa Rica (97.5%, a difference of 0.010%), and Sudanese (97.5%, a difference of 0.020%).
DemographicsRating | Rank3rd Grade
Uruguayans
5.0
/100
|
#221
Tragic
97.5%
Sierra Leoneans
4.6
/100
|
#222
Tragic
97.5%
Immigrants | Syria
4.4
/100
|
#223
Tragic
97.5%
Bahamians
4.4
/100
|
#224
Tragic
97.5%
Tongans
4.3
/100
|
#225
Tragic
97.5%
Sudanese
4.1
/100
|
#226
Tragic
97.5%
Immigrants | Sudan
3.4
/100
|
#227
Tragic
97.5%
Sub-Saharan Africans
3.2
/100
|
#228
Tragic
97.5%
Senegalese
3.0
/100
|
#229
Tragic
97.5%
Immigrants | Pakistan
2.7
/100
|
#230
Tragic
97.5%
Immigrants | Costa Rica
2.7
/100
|
#231
Tragic
97.5%
Immigrants | Western Asia
2.6
/100
|
#232
Tragic
97.5%
Immigrants | Malaysia
2.4
/100
|
#233
Tragic
97.5%
Immigrants | Eastern Asia
1.9
/100
|
#234
Tragic
97.4%
Immigrants | Iraq
1.8
/100
|
#235
Tragic
97.4%

Demographics Similar to Latvians by 3rd Grade

In terms of 3rd grade, the demographic groups most similar to Latvians are Italian (98.4%, a difference of 0.010%), Chippewa (98.4%, a difference of 0.010%), Eastern European (98.3%, a difference of 0.010%), British (98.4%, a difference of 0.020%), and Luxembourger (98.3%, a difference of 0.020%).
DemographicsRating | Rank3rd Grade
Scandinavians
100.0
/100
|
#32
Exceptional
98.4%
Chinese
100.0
/100
|
#33
Exceptional
98.4%
Swiss
100.0
/100
|
#34
Exceptional
98.4%
Arapaho
100.0
/100
|
#35
Exceptional
98.4%
British
99.9
/100
|
#36
Exceptional
98.4%
Italians
99.9
/100
|
#37
Exceptional
98.4%
Chippewa
99.9
/100
|
#38
Exceptional
98.4%
Latvians
99.9
/100
|
#39
Exceptional
98.4%
Eastern Europeans
99.9
/100
|
#40
Exceptional
98.3%
Luxembourgers
99.9
/100
|
#41
Exceptional
98.3%
Belgians
99.9
/100
|
#42
Exceptional
98.3%
Northern Europeans
99.9
/100
|
#43
Exceptional
98.3%
Hungarians
99.9
/100
|
#44
Exceptional
98.3%
Native Hawaiians
99.9
/100
|
#45
Exceptional
98.3%
Ottawa
99.8
/100
|
#46
Exceptional
98.3%