Subsaharan African vs Immigrants from Ghana Bachelor's Degree

COMPARE

Subsaharan African
Race
Ancestry
AfghanAfricanAlaska NativeAlaskan AthabascanAlbanianAleutAlsatianAmericanApacheArabArapahoArgentineanArmenianAssyrian/Chaldean/SyriacAustralianAustrianBahamianBangladeshiBarbadianBasqueBelgianBelizeanBermudanBhutaneseBlackfeetBolivianBrazilianBritishBritish West IndianBulgarianBurmeseCajunCambodianCanadianCape VerdeanCarpatho RusynCelticCentral AmericanCentral American IndianCherokeeCheyenneChickasawChileanChineseChippewaChoctawColombianColvilleComancheCosta RicanCreeCreekCroatianCrowCubanCypriotCzechCzechoslovakianDanishDelawareDominicanDutchDutch West IndianEastern EuropeanEcuadorianEgyptianEnglishEstonianEthiopianEuropeanFijianFilipinoFinnishFrenchFrench American IndianFrench CanadianGermanGerman RussianGhanaianGreekGuamanian/ChamorroGuatemalanGuyaneseHaitianHmongHonduranHopiHoumaHungarianIcelanderIndian (Asian)IndonesianInupiatIranianIraqiIrishIroquoisIsraeliItalianJamaicanJapaneseJordanianKenyanKiowaKoreanLaotianLatvianLebaneseLiberianLithuanianLumbeeLuxembourgerMacedonianMalaysianMalteseMarshalleseMenomineeMexicanMexican American IndianMongolianMoroccanNative HawaiianNavajoNepaleseNew ZealanderNicaraguanNigerianNorthern EuropeanNorwegianOkinawanOsageOttawaPaiutePakistaniPalestinianPanamanianParaguayanPennsylvania GermanPeruvianPimaPolishPortuguesePotawatomiPuebloPuerto RicanPuget Sound SalishRomanianRussianSalvadoranSamoanScandinavianScotch-IrishScottishSeminoleSenegaleseSerbianShoshoneSierra LeoneanSiouxSlavicSlovakSloveneSomaliSouth AfricanSouth AmericanSouth American IndianSoviet UnionSpaniardSpanishSpanish AmericanSpanish American IndianSri LankanSubsaharan AfricanSudaneseSwedishSwissSyrianTaiwaneseThaiTlingit-HaidaTohono O'OdhamTonganTrinidadian and TobagonianTsimshianTurkishU.S. Virgin IslanderUgandanUkrainianUruguayanUteVenezuelanVietnameseWelshWest IndianYakamaYaquiYugoslavianYumanYup'ikZimbabwean
Immigration
NonimmigrantsImmigrantsAfghanistanAfricaAlbaniaArgentinaArmeniaAsiaAustraliaAustriaBahamasBangladeshBarbadosBelarusBelgiumBelizeBoliviaBosnia and HerzegovinaBrazilBulgariaBurma/MyanmarCabo VerdeCambodiaCameroonCanadaCaribbeanCentral AmericaChileChinaColombiaCongoCosta RicaCroatiaCubaCzechoslovakiaDenmarkDominicaDominican RepublicEastern AfricaEastern AsiaEastern EuropeEcuadorEgyptEl SalvadorEnglandEritreaEthiopiaEuropeFijiFranceGermanyGreeceGrenadaGuatemalaGuyanaHaitiHondurasHong KongHungaryIndiaIndonesiaIranIraqIrelandIsraelItalyJamaicaJapanJordanKazakhstanKenyaKoreaKuwaitLaosLatin AmericaLatviaLebanonLiberiaLithuaniaMalaysiaMexicoMicronesiaMiddle AfricaMoldovaMoroccoNepalNetherlandsNicaraguaNigeriaNorth AmericaNorth MacedoniaNorthern AfricaNorthern EuropeNorwayOceaniaPakistanPanamaPeruPhilippinesPolandPortugalRomaniaRussiaSaudi ArabiaScotlandSenegalSerbiaSierra LeoneSingaporeSomaliaSouth AfricaSouth AmericaSouth Central AsiaSouth Eastern AsiaSouthern EuropeSpainSri LankaSt. Vincent and the GrenadinesSudanSwedenSwitzerlandSyriaTaiwanThailandTrinidad and TobagoTurkeyUgandaUkraineUruguayUzbekistanVenezuelaVietnamWest IndiesWestern AfricaWestern AsiaWestern EuropeYemenZaireZimbabweAzores
Immigrants from Ghana
Race
Ancestry
AfghanAfricanAlaska NativeAlaskan AthabascanAlbanianAleutAlsatianAmericanApacheArabArapahoArgentineanArmenianAssyrian/Chaldean/SyriacAustralianAustrianBahamianBangladeshiBarbadianBasqueBelgianBelizeanBermudanBhutaneseBlackfeetBolivianBrazilianBritishBritish West IndianBulgarianBurmeseCajunCambodianCanadianCape VerdeanCarpatho RusynCelticCentral AmericanCentral American IndianCherokeeCheyenneChickasawChileanChineseChippewaChoctawColombianColvilleComancheCosta RicanCreeCreekCroatianCrowCubanCypriotCzechCzechoslovakianDanishDelawareDominicanDutchDutch West IndianEastern EuropeanEcuadorianEgyptianEnglishEstonianEthiopianEuropeanFijianFilipinoFinnishFrenchFrench American IndianFrench CanadianGermanGerman RussianGhanaianGreekGuamanian/ChamorroGuatemalanGuyaneseHaitianHmongHonduranHopiHoumaHungarianIcelanderIndian (Asian)IndonesianInupiatIranianIraqiIrishIroquoisIsraeliItalianJamaicanJapaneseJordanianKenyanKiowaKoreanLaotianLatvianLebaneseLiberianLithuanianLumbeeLuxembourgerMacedonianMalaysianMalteseMarshalleseMenomineeMexicanMexican American IndianMongolianMoroccanNative HawaiianNavajoNepaleseNew ZealanderNicaraguanNigerianNorthern EuropeanNorwegianOkinawanOsageOttawaPaiutePakistaniPalestinianPanamanianParaguayanPennsylvania GermanPeruvianPimaPolishPortuguesePotawatomiPuebloPuerto RicanPuget Sound SalishRomanianRussianSalvadoranSamoanScandinavianScotch-IrishScottishSeminoleSenegaleseSerbianShoshoneSierra LeoneanSiouxSlavicSlovakSloveneSomaliSouth AfricanSouth AmericanSouth American IndianSoviet UnionSpaniardSpanishSpanish AmericanSpanish American IndianSri LankanSudaneseSwedishSwissSyrianTaiwaneseThaiTlingit-HaidaTohono O'OdhamTonganTrinidadian and TobagonianTsimshianTurkishU.S. Virgin IslanderUgandanUkrainianUruguayanUteVenezuelanVietnameseWelshWest IndianYakamaYaquiYugoslavianYumanYup'ikZimbabwean
Immigration
NonimmigrantsImmigrantsAfghanistanAfricaAlbaniaArgentinaArmeniaAsiaAustraliaAustriaBahamasBangladeshBarbadosBelarusBelgiumBelizeBoliviaBosnia and HerzegovinaBrazilBulgariaBurma/MyanmarCabo VerdeCambodiaCameroonCanadaCaribbeanCentral AmericaChileChinaColombiaCongoCosta RicaCroatiaCubaCzechoslovakiaDenmarkDominicaDominican RepublicEastern AfricaEastern AsiaEastern EuropeEcuadorEgyptEl SalvadorEnglandEritreaEthiopiaEuropeFijiFranceGermanyGhanaGreeceGrenadaGuatemalaGuyanaHaitiHondurasHong KongHungaryIndiaIndonesiaIranIraqIrelandIsraelItalyJamaicaJapanJordanKazakhstanKenyaKoreaKuwaitLaosLatin AmericaLatviaLebanonLiberiaLithuaniaMalaysiaMexicoMicronesiaMiddle AfricaMoldovaMoroccoNepalNetherlandsNicaraguaNigeriaNorth AmericaNorth MacedoniaNorthern AfricaNorthern EuropeNorwayOceaniaPakistanPanamaPeruPhilippinesPolandPortugalRomaniaRussiaSaudi ArabiaScotlandSenegalSerbiaSierra LeoneSingaporeSomaliaSouth AfricaSouth AmericaSouth Central AsiaSouth Eastern AsiaSouthern EuropeSpainSri LankaSt. Vincent and the GrenadinesSudanSwedenSwitzerlandSyriaTaiwanThailandTrinidad and TobagoTurkeyUgandaUkraineUruguayUzbekistanVenezuelaVietnamWest IndiesWestern AfricaWestern AsiaWestern EuropeYemenZaireZimbabweAzores
Bachelor's Degree
Income
Poverty
Unemployment
Labor Participation
Family Structure
Vehicle Availability
Education Level
Disability

Bachelor's Degree Comparison

Sub-Saharan Africans

Immigrants from Ghana

Tragic
Fair
35.8%
BACHELOR'S DEGREE
9.8/ 100
METRIC RATING
218th/ 347
METRIC RANK
36.9%
BACHELOR'S DEGREE
27.4/ 100
METRIC RATING
200th/ 347
METRIC RANK

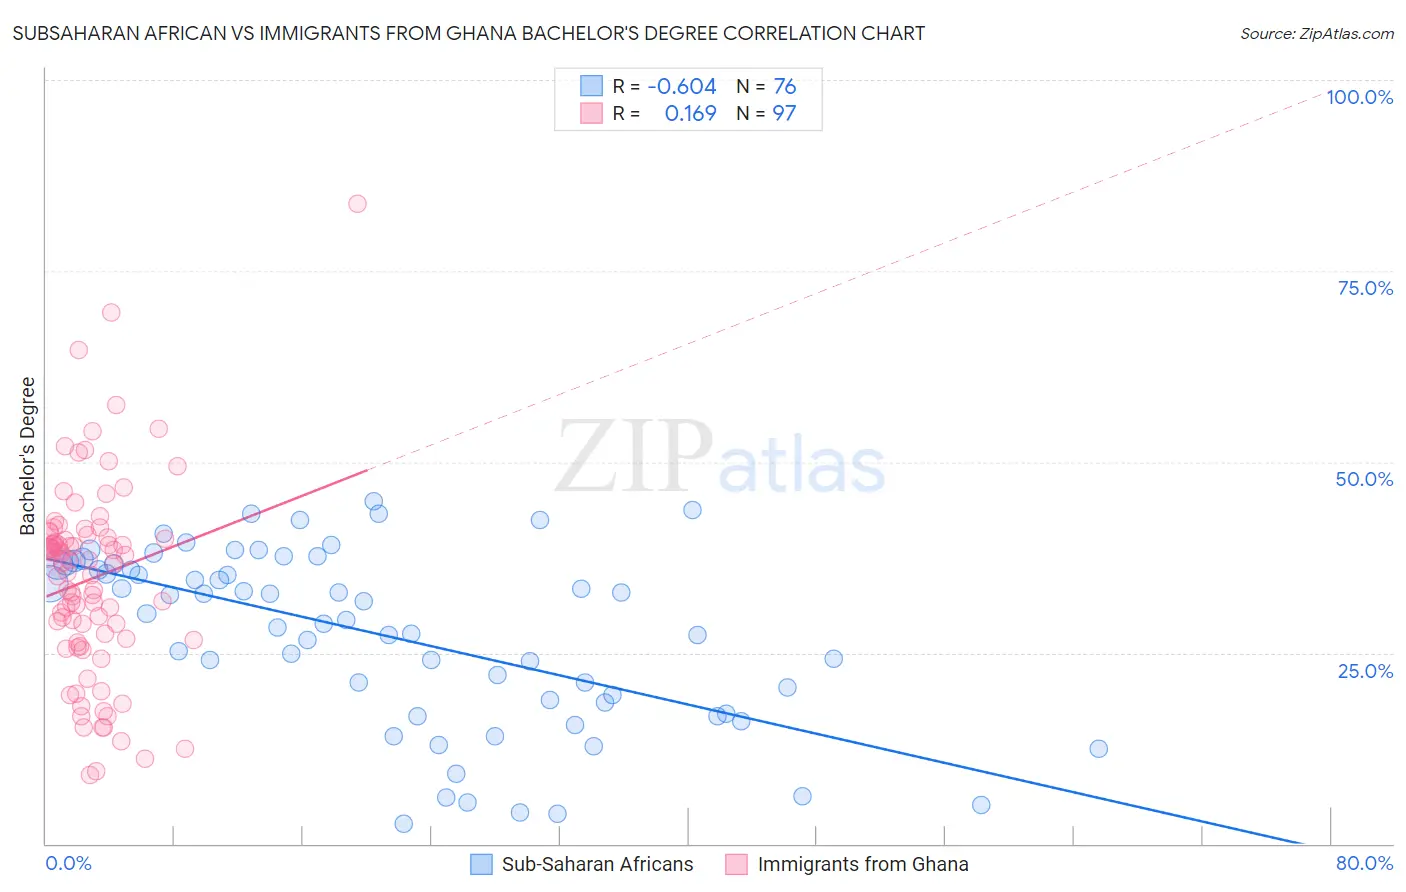
Subsaharan African vs Immigrants from Ghana Bachelor's Degree Correlation Chart

The statistical analysis conducted on geographies consisting of 508,116,051 people shows a significant negative correlation between the proportion of Sub-Saharan Africans and percentage of population with at least bachelor's degree education in the United States with a correlation coefficient (R) of -0.604 and weighted average of 35.8%. Similarly, the statistical analysis conducted on geographies consisting of 199,935,745 people shows a poor positive correlation between the proportion of Immigrants from Ghana and percentage of population with at least bachelor's degree education in the United States with a correlation coefficient (R) of 0.169 and weighted average of 36.9%, a difference of 3.2%.
Subsaharan African vs Immigrants from Ghana Bachelor's Degree

Bachelor's Degree Correlation Summary

MeasurementSubsaharan AfricanImmigrants from Ghana
Minimum2.6%9.1%
Maximum44.9%83.8%
Range42.3%74.7%
Mean27.3%34.7%
Median29.7%36.8%
Interquartile 25% (IQ1)18.7%26.7%
Interquartile 75% (IQ3)36.6%40.3%
Interquartile Range (IQR)17.9%13.5%
Standard Deviation (Sample)11.5%12.8%
Standard Deviation (Population)11.4%12.7%

Demographics Similar to Sub-Saharan Africans and Immigrants from Ghana by Bachelor's Degree

In terms of bachelor's degree, the demographic groups most similar to Sub-Saharan Africans are West Indian (35.8%, a difference of 0.030%), German Russian (35.8%, a difference of 0.10%), Barbadian (36.1%, a difference of 0.92%), Immigrants from Western Africa (36.1%, a difference of 0.98%), and German (36.1%, a difference of 1.0%). Similarly, the demographic groups most similar to Immigrants from Ghana are Immigrants from Costa Rica (36.9%, a difference of 0.0%), Immigrants from South Eastern Asia (36.8%, a difference of 0.26%), Immigrants from Zaire (36.8%, a difference of 0.27%), Immigrants from Nigeria (36.7%, a difference of 0.57%), and Immigrants (36.7%, a difference of 0.61%).
DemographicsRating | RankBachelor's Degree
Immigrants | Costa Rica
27.4
/100
|
#199
Fair
36.9%
Immigrants | Ghana
27.4
/100
|
#200
Fair
36.9%
Immigrants | South Eastern Asia
25.4
/100
|
#201
Fair
36.8%
Immigrants | Zaire
25.3
/100
|
#202
Fair
36.8%
Immigrants | Nigeria
23.1
/100
|
#203
Fair
36.7%
Immigrants | Immigrants
22.8
/100
|
#204
Fair
36.7%
Finns
22.2
/100
|
#205
Fair
36.7%
Spaniards
21.2
/100
|
#206
Fair
36.6%
Immigrants | Middle Africa
20.6
/100
|
#207
Fair
36.6%
Immigrants | Thailand
19.4
/100
|
#208
Poor
36.5%
Panamanians
18.8
/100
|
#209
Poor
36.5%
French
18.6
/100
|
#210
Poor
36.5%
Scotch-Irish
18.3
/100
|
#211
Poor
36.4%
Immigrants | Philippines
17.8
/100
|
#212
Poor
36.4%
Immigrants | Panama
14.2
/100
|
#213
Poor
36.2%
Germans
13.9
/100
|
#214
Poor
36.1%
Immigrants | Western Africa
13.8
/100
|
#215
Poor
36.1%
Barbadians
13.5
/100
|
#216
Poor
36.1%
German Russians
10.2
/100
|
#217
Poor
35.8%
Sub-Saharan Africans
9.8
/100
|
#218
Tragic
35.8%
West Indians
9.7
/100
|
#219
Tragic
35.8%