Sri Lankan vs Immigrants from Eastern Europe Associate's Degree
COMPARE
Sri Lankan
Immigrants from Eastern Europe
Associate's Degree
Associate's Degree Comparison
Sri Lankans
Immigrants from Eastern Europe
46.3%
ASSOCIATE'S DEGREE
47.6/ 100
METRIC RATING
179th/ 347
METRIC RANK
50.5%
ASSOCIATE'S DEGREE
99.1/ 100
METRIC RATING
78th/ 347
METRIC RANK
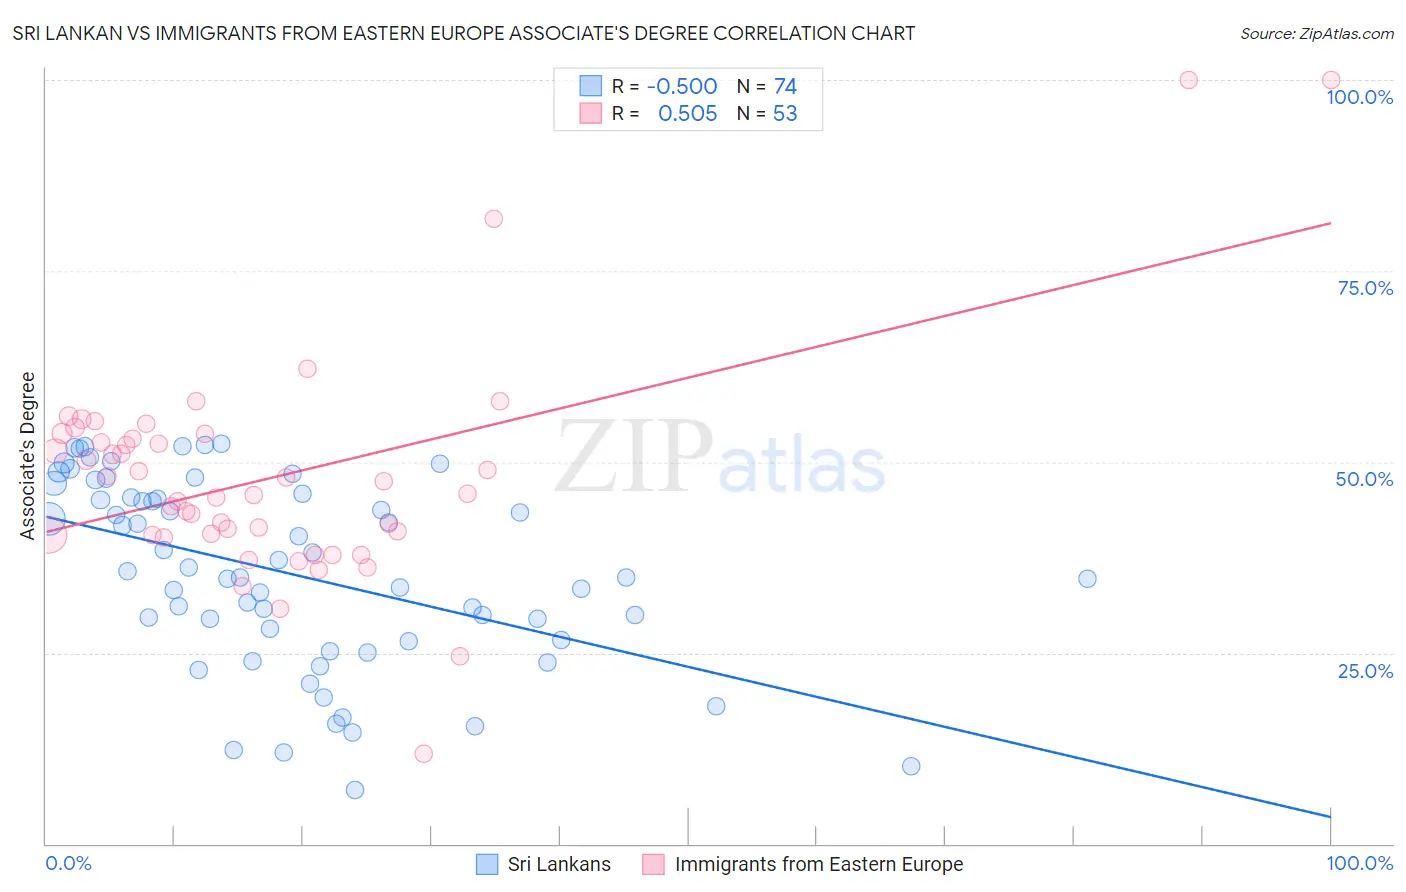
Sri Lankan vs Immigrants from Eastern Europe Associate's Degree Correlation Chart
The statistical analysis conducted on geographies consisting of 440,543,286 people shows a substantial negative correlation between the proportion of Sri Lankans and percentage of population with at least associate's degree education in the United States with a correlation coefficient (R) of -0.500 and weighted average of 46.3%. Similarly, the statistical analysis conducted on geographies consisting of 475,831,649 people shows a substantial positive correlation between the proportion of Immigrants from Eastern Europe and percentage of population with at least associate's degree education in the United States with a correlation coefficient (R) of 0.505 and weighted average of 50.5%, a difference of 9.0%.
Associate's Degree Correlation Summary
| Measurement | Sri Lankan | Immigrants from Eastern Europe |
| Minimum | 7.0% | 11.8% |
| Maximum | 52.3% | 100.0% |
| Range | 45.3% | 88.2% |
| Mean | 35.4% | 47.9% |
| Median | 35.3% | 45.8% |
| Interquartile 25% (IQ1) | 26.6% | 40.4% |
| Interquartile 75% (IQ3) | 45.3% | 53.3% |
| Interquartile Range (IQR) | 18.7% | 12.9% |
| Standard Deviation (Sample) | 12.2% | 14.6% |
| Standard Deviation (Population) | 12.1% | 14.5% |
Similar Demographics by Associate's Degree
Demographics Similar to Sri Lankans by Associate's Degree
In terms of associate's degree, the demographic groups most similar to Sri Lankans are Immigrants from Bosnia and Herzegovina (46.3%, a difference of 0.050%), Slovak (46.3%, a difference of 0.060%), Finnish (46.3%, a difference of 0.070%), Bermudan (46.2%, a difference of 0.090%), and Belgian (46.3%, a difference of 0.10%).
| Demographics | Rating | Rank | Associate's Degree |
| Peruvians | 50.5 /100 | #172 | Average 46.4% |
| Immigrants | Iraq | 50.3 /100 | #173 | Average 46.4% |
| English | 50.0 /100 | #174 | Average 46.4% |
| Belgians | 48.9 /100 | #175 | Average 46.3% |
| Finns | 48.5 /100 | #176 | Average 46.3% |
| Slovaks | 48.4 /100 | #177 | Average 46.3% |
| Immigrants | Bosnia and Herzegovina | 48.3 /100 | #178 | Average 46.3% |
| Sri Lankans | 47.6 /100 | #179 | Average 46.3% |
| Bermudans | 46.4 /100 | #180 | Average 46.2% |
| Immigrants | Colombia | 41.3 /100 | #181 | Average 46.0% |
| Swiss | 40.4 /100 | #182 | Average 46.0% |
| Yugoslavians | 40.2 /100 | #183 | Average 46.0% |
| Czechoslovakians | 40.0 /100 | #184 | Average 46.0% |
| Costa Ricans | 38.6 /100 | #185 | Fair 46.0% |
| Welsh | 37.9 /100 | #186 | Fair 45.9% |
Demographics Similar to Immigrants from Eastern Europe by Associate's Degree
In terms of associate's degree, the demographic groups most similar to Immigrants from Eastern Europe are Ethiopian (50.4%, a difference of 0.010%), Immigrants from Lebanon (50.5%, a difference of 0.040%), Armenian (50.4%, a difference of 0.050%), Immigrants from Zimbabwe (50.5%, a difference of 0.080%), and Maltese (50.4%, a difference of 0.12%).
| Demographics | Rating | Rank | Associate's Degree |
| Immigrants | Romania | 99.5 /100 | #71 | Exceptional 50.9% |
| Immigrants | Pakistan | 99.5 /100 | #72 | Exceptional 50.9% |
| Carpatho Rusyns | 99.3 /100 | #73 | Exceptional 50.6% |
| Lithuanians | 99.3 /100 | #74 | Exceptional 50.6% |
| Immigrants | Scotland | 99.3 /100 | #75 | Exceptional 50.6% |
| Immigrants | Zimbabwe | 99.2 /100 | #76 | Exceptional 50.5% |
| Immigrants | Lebanon | 99.1 /100 | #77 | Exceptional 50.5% |
| Immigrants | Eastern Europe | 99.1 /100 | #78 | Exceptional 50.5% |
| Ethiopians | 99.1 /100 | #79 | Exceptional 50.4% |
| Armenians | 99.1 /100 | #80 | Exceptional 50.4% |
| Maltese | 99.1 /100 | #81 | Exceptional 50.4% |
| Greeks | 98.9 /100 | #82 | Exceptional 50.3% |
| Immigrants | Uzbekistan | 98.9 /100 | #83 | Exceptional 50.3% |
| Immigrants | Hungary | 98.9 /100 | #84 | Exceptional 50.2% |
| Immigrants | Egypt | 98.9 /100 | #85 | Exceptional 50.2% |