Sri Lankan vs Hawaiian Professional Degree
COMPARE
Sri Lankan
Hawaiian
Professional Degree
Professional Degree Comparison
Sri Lankans
Hawaiians
4.3%
PROFESSIONAL DEGREE
29.0/ 100
METRIC RATING
191st/ 347
METRIC RANK
3.4%
PROFESSIONAL DEGREE
0.2/ 100
METRIC RATING
296th/ 347
METRIC RANK
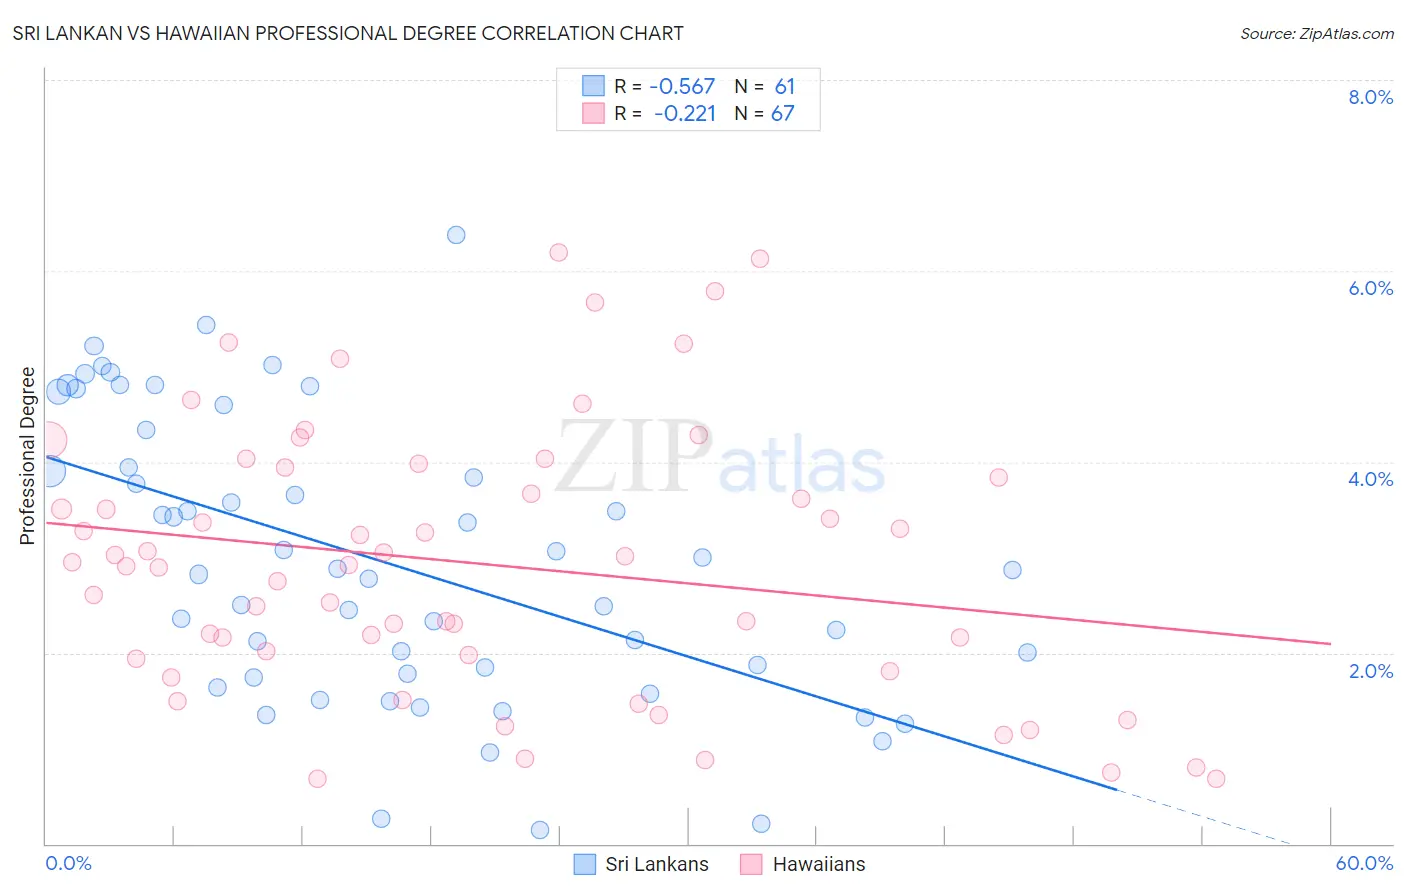
Sri Lankan vs Hawaiian Professional Degree Correlation Chart
The statistical analysis conducted on geographies consisting of 439,314,043 people shows a substantial negative correlation between the proportion of Sri Lankans and percentage of population with at least professional degree education in the United States with a correlation coefficient (R) of -0.567 and weighted average of 4.3%. Similarly, the statistical analysis conducted on geographies consisting of 326,653,731 people shows a weak negative correlation between the proportion of Hawaiians and percentage of population with at least professional degree education in the United States with a correlation coefficient (R) of -0.221 and weighted average of 3.4%, a difference of 23.8%.
Professional Degree Correlation Summary
| Measurement | Sri Lankan | Hawaiian |
| Minimum | 0.14% | 0.68% |
| Maximum | 6.4% | 6.2% |
| Range | 6.2% | 5.5% |
| Mean | 3.0% | 2.9% |
| Median | 2.9% | 2.9% |
| Interquartile 25% (IQ1) | 1.8% | 1.9% |
| Interquartile 75% (IQ3) | 4.1% | 3.9% |
| Interquartile Range (IQR) | 2.4% | 2.0% |
| Standard Deviation (Sample) | 1.5% | 1.4% |
| Standard Deviation (Population) | 1.5% | 1.4% |
Similar Demographics by Professional Degree
Demographics Similar to Sri Lankans by Professional Degree
In terms of professional degree, the demographic groups most similar to Sri Lankans are Immigrants from Poland (4.3%, a difference of 0.040%), Slovak (4.3%, a difference of 0.30%), Ghanaian (4.3%, a difference of 0.32%), French (4.2%, a difference of 0.37%), and Immigrants from Thailand (4.3%, a difference of 0.47%).
| Demographics | Rating | Rank | Professional Degree |
| Belgians | 36.2 /100 | #184 | Fair 4.3% |
| Welsh | 35.8 /100 | #185 | Fair 4.3% |
| Scotch-Irish | 34.2 /100 | #186 | Fair 4.3% |
| Immigrants | Cameroon | 33.3 /100 | #187 | Fair 4.3% |
| Immigrants | Thailand | 31.7 /100 | #188 | Fair 4.3% |
| Slovaks | 30.7 /100 | #189 | Fair 4.3% |
| Immigrants | Poland | 29.2 /100 | #190 | Fair 4.3% |
| Sri Lankans | 29.0 /100 | #191 | Fair 4.3% |
| Ghanaians | 27.3 /100 | #192 | Fair 4.3% |
| French | 27.1 /100 | #193 | Fair 4.2% |
| Scandinavians | 25.8 /100 | #194 | Fair 4.2% |
| Nigerians | 24.6 /100 | #195 | Fair 4.2% |
| Spanish | 23.0 /100 | #196 | Fair 4.2% |
| Czechoslovakians | 22.4 /100 | #197 | Fair 4.2% |
| Immigrants | Middle Africa | 22.1 /100 | #198 | Fair 4.2% |
Demographics Similar to Hawaiians by Professional Degree
In terms of professional degree, the demographic groups most similar to Hawaiians are Immigrants from Guatemala (3.4%, a difference of 0.010%), Paiute (3.4%, a difference of 0.16%), Immigrants from Honduras (3.5%, a difference of 0.25%), Immigrants from Liberia (3.4%, a difference of 0.34%), and Ottawa (3.4%, a difference of 0.39%).
| Demographics | Rating | Rank | Professional Degree |
| Guatemalans | 0.3 /100 | #289 | Tragic 3.5% |
| Chippewa | 0.3 /100 | #290 | Tragic 3.5% |
| Alaska Natives | 0.3 /100 | #291 | Tragic 3.5% |
| Immigrants | Belize | 0.3 /100 | #292 | Tragic 3.5% |
| Immigrants | Honduras | 0.3 /100 | #293 | Tragic 3.5% |
| Paiute | 0.3 /100 | #294 | Tragic 3.4% |
| Immigrants | Guatemala | 0.2 /100 | #295 | Tragic 3.4% |
| Hawaiians | 0.2 /100 | #296 | Tragic 3.4% |
| Immigrants | Liberia | 0.2 /100 | #297 | Tragic 3.4% |
| Ottawa | 0.2 /100 | #298 | Tragic 3.4% |
| Immigrants | Yemen | 0.2 /100 | #299 | Tragic 3.4% |
| Blacks/African Americans | 0.2 /100 | #300 | Tragic 3.4% |
| Immigrants | Dominican Republic | 0.2 /100 | #301 | Tragic 3.4% |
| Malaysians | 0.2 /100 | #302 | Tragic 3.4% |
| Immigrants | Haiti | 0.2 /100 | #303 | Tragic 3.4% |