Sri Lankan vs Guamanian/Chamorro High School Diploma

COMPARE

Sri Lankan
Race
Ancestry
AfghanAfricanAlaska NativeAlaskan AthabascanAlbanianAleutAlsatianAmericanApacheArabArapahoArgentineanArmenianAssyrian/Chaldean/SyriacAustralianAustrianBahamianBangladeshiBarbadianBasqueBelgianBelizeanBermudanBhutaneseBlackfeetBolivianBrazilianBritishBritish West IndianBulgarianBurmeseCajunCambodianCanadianCape VerdeanCarpatho RusynCelticCentral AmericanCentral American IndianCherokeeCheyenneChickasawChileanChineseChippewaChoctawColombianColvilleComancheCosta RicanCreeCreekCroatianCrowCubanCypriotCzechCzechoslovakianDanishDelawareDominicanDutchDutch West IndianEastern EuropeanEcuadorianEgyptianEnglishEstonianEthiopianEuropeanFijianFilipinoFinnishFrenchFrench American IndianFrench CanadianGermanGerman RussianGhanaianGreekGuatemalanGuyaneseHaitianHmongHonduranHopiHoumaHungarianIcelanderIndian (Asian)IndonesianInupiatIranianIraqiIrishIroquoisIsraeliItalianJamaicanJapaneseJordanianKenyanKiowaKoreanLaotianLatvianLebaneseLiberianLithuanianLumbeeLuxembourgerMacedonianMalaysianMalteseMarshalleseMenomineeMexicanMexican American IndianMongolianMoroccanNative HawaiianNavajoNepaleseNew ZealanderNicaraguanNigerianNorthern EuropeanNorwegianOkinawanOsageOttawaPaiutePakistaniPalestinianPanamanianParaguayanPennsylvania GermanPeruvianPimaPolishPortuguesePotawatomiPuebloPuerto RicanPuget Sound SalishRomanianRussianSalvadoranSamoanScandinavianScotch-IrishScottishSeminoleSenegaleseSerbianShoshoneSierra LeoneanSiouxSlavicSlovakSloveneSomaliSouth AfricanSouth AmericanSouth American IndianSoviet UnionSpaniardSpanishSpanish AmericanSpanish American IndianSri LankanSubsaharan AfricanSudaneseSwedishSwissSyrianTaiwaneseThaiTlingit-HaidaTohono O'OdhamTonganTrinidadian and TobagonianTsimshianTurkishU.S. Virgin IslanderUgandanUkrainianUruguayanUteVenezuelanVietnameseWelshWest IndianYakamaYaquiYugoslavianYumanYup'ikZimbabwean
Immigration
NonimmigrantsImmigrantsAfghanistanAfricaAlbaniaArgentinaArmeniaAsiaAustraliaAustriaBahamasBangladeshBarbadosBelarusBelgiumBelizeBoliviaBosnia and HerzegovinaBrazilBulgariaBurma/MyanmarCabo VerdeCambodiaCameroonCanadaCaribbeanCentral AmericaChileChinaColombiaCongoCosta RicaCroatiaCubaCzechoslovakiaDenmarkDominicaDominican RepublicEastern AfricaEastern AsiaEastern EuropeEcuadorEgyptEl SalvadorEnglandEritreaEthiopiaEuropeFijiFranceGermanyGhanaGreeceGrenadaGuatemalaGuyanaHaitiHondurasHong KongHungaryIndiaIndonesiaIranIraqIrelandIsraelItalyJamaicaJapanJordanKazakhstanKenyaKoreaKuwaitLaosLatin AmericaLatviaLebanonLiberiaLithuaniaMalaysiaMexicoMicronesiaMiddle AfricaMoldovaMoroccoNepalNetherlandsNicaraguaNigeriaNorth AmericaNorth MacedoniaNorthern AfricaNorthern EuropeNorwayOceaniaPakistanPanamaPeruPhilippinesPolandPortugalRomaniaRussiaSaudi ArabiaScotlandSenegalSerbiaSierra LeoneSingaporeSomaliaSouth AfricaSouth AmericaSouth Central AsiaSouth Eastern AsiaSouthern EuropeSpainSri LankaSt. Vincent and the GrenadinesSudanSwedenSwitzerlandSyriaTaiwanThailandTrinidad and TobagoTurkeyUgandaUkraineUruguayUzbekistanVenezuelaVietnamWest IndiesWestern AfricaWestern AsiaWestern EuropeYemenZaireZimbabweAzores
Guamanian/Chamorro
Race
Ancestry
AfghanAfricanAlaska NativeAlaskan AthabascanAlbanianAleutAlsatianAmericanApacheArabArapahoArgentineanArmenianAssyrian/Chaldean/SyriacAustralianAustrianBahamianBangladeshiBarbadianBasqueBelgianBelizeanBermudanBhutaneseBlackfeetBolivianBrazilianBritishBritish West IndianBulgarianBurmeseCajunCambodianCanadianCape VerdeanCarpatho RusynCelticCentral AmericanCentral American IndianCherokeeCheyenneChickasawChileanChineseChippewaChoctawColombianColvilleComancheCosta RicanCreeCreekCroatianCrowCubanCypriotCzechCzechoslovakianDanishDelawareDominicanDutchDutch West IndianEastern EuropeanEcuadorianEgyptianEnglishEstonianEthiopianEuropeanFijianFilipinoFinnishFrenchFrench American IndianFrench CanadianGermanGerman RussianGhanaianGreekGuamanian/ChamorroGuatemalanGuyaneseHaitianHmongHonduranHopiHoumaHungarianIcelanderIndian (Asian)IndonesianInupiatIranianIraqiIrishIroquoisIsraeliItalianJamaicanJapaneseJordanianKenyanKiowaKoreanLaotianLatvianLebaneseLiberianLithuanianLumbeeLuxembourgerMacedonianMalaysianMalteseMarshalleseMenomineeMexicanMexican American IndianMongolianMoroccanNative HawaiianNavajoNepaleseNew ZealanderNicaraguanNigerianNorthern EuropeanNorwegianOkinawanOsageOttawaPaiutePakistaniPalestinianPanamanianParaguayanPennsylvania GermanPeruvianPimaPolishPortuguesePotawatomiPuebloPuerto RicanPuget Sound SalishRomanianRussianSalvadoranSamoanScandinavianScotch-IrishScottishSeminoleSenegaleseSerbianShoshoneSierra LeoneanSiouxSlavicSlovakSloveneSomaliSouth AfricanSouth AmericanSouth American IndianSoviet UnionSpaniardSpanishSpanish AmericanSpanish American IndianSubsaharan AfricanSudaneseSwedishSwissSyrianTaiwaneseThaiTlingit-HaidaTohono O'OdhamTonganTrinidadian and TobagonianTsimshianTurkishU.S. Virgin IslanderUgandanUkrainianUruguayanUteVenezuelanVietnameseWelshWest IndianYakamaYaquiYugoslavianYumanYup'ikZimbabwean
Immigration
NonimmigrantsImmigrantsAfghanistanAfricaAlbaniaArgentinaArmeniaAsiaAustraliaAustriaBahamasBangladeshBarbadosBelarusBelgiumBelizeBoliviaBosnia and HerzegovinaBrazilBulgariaBurma/MyanmarCabo VerdeCambodiaCameroonCanadaCaribbeanCentral AmericaChileChinaColombiaCongoCosta RicaCroatiaCubaCzechoslovakiaDenmarkDominicaDominican RepublicEastern AfricaEastern AsiaEastern EuropeEcuadorEgyptEl SalvadorEnglandEritreaEthiopiaEuropeFijiFranceGermanyGhanaGreeceGrenadaGuatemalaGuyanaHaitiHondurasHong KongHungaryIndiaIndonesiaIranIraqIrelandIsraelItalyJamaicaJapanJordanKazakhstanKenyaKoreaKuwaitLaosLatin AmericaLatviaLebanonLiberiaLithuaniaMalaysiaMexicoMicronesiaMiddle AfricaMoldovaMoroccoNepalNetherlandsNicaraguaNigeriaNorth AmericaNorth MacedoniaNorthern AfricaNorthern EuropeNorwayOceaniaPakistanPanamaPeruPhilippinesPolandPortugalRomaniaRussiaSaudi ArabiaScotlandSenegalSerbiaSierra LeoneSingaporeSomaliaSouth AfricaSouth AmericaSouth Central AsiaSouth Eastern AsiaSouthern EuropeSpainSri LankaSt. Vincent and the GrenadinesSudanSwedenSwitzerlandSyriaTaiwanThailandTrinidad and TobagoTurkeyUgandaUkraineUruguayUzbekistanVenezuelaVietnamWest IndiesWestern AfricaWestern AsiaWestern EuropeYemenZaireZimbabweAzores
High School Diploma
Income
Poverty
Unemployment
Labor Participation
Family Structure
Vehicle Availability
Education Level
Disability

High School Diploma Comparison

Sri Lankans

Guamanians/Chamorros

Tragic
Fair
87.0%
HIGH SCHOOL DIPLOMA
0.2/ 100
METRIC RATING
269th/ 347
METRIC RANK
88.9%
HIGH SCHOOL DIPLOMA
35.5/ 100
METRIC RATING
187th/ 347
METRIC RANK

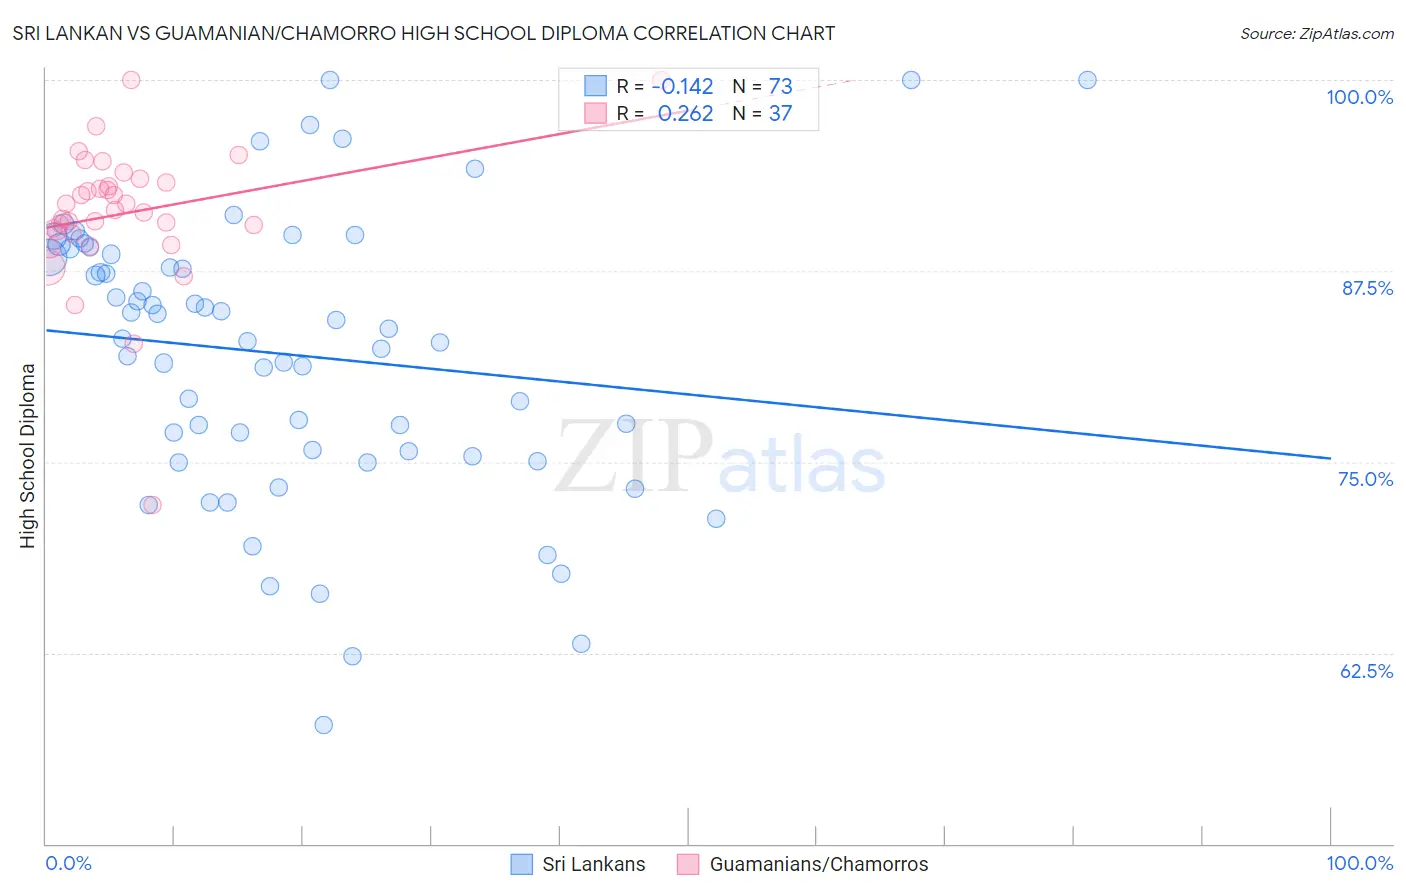
Sri Lankan vs Guamanian/Chamorro High School Diploma Correlation Chart

The statistical analysis conducted on geographies consisting of 440,593,537 people shows a poor negative correlation between the proportion of Sri Lankans and percentage of population with at least high school diploma education in the United States with a correlation coefficient (R) of -0.142 and weighted average of 87.0%. Similarly, the statistical analysis conducted on geographies consisting of 221,965,618 people shows a weak positive correlation between the proportion of Guamanians/Chamorros and percentage of population with at least high school diploma education in the United States with a correlation coefficient (R) of 0.262 and weighted average of 88.9%, a difference of 2.2%.
Sri Lankan vs Guamanian/Chamorro High School Diploma

High School Diploma Correlation Summary

MeasurementSri LankanGuamanian/Chamorro
Minimum57.8%72.2%
Maximum100.0%100.0%
Range42.2%27.8%
Mean82.1%91.3%
Median83.1%91.5%
Interquartile 25% (IQ1)75.5%90.0%
Interquartile 75% (IQ3)88.8%93.4%
Interquartile Range (IQR)13.3%3.4%
Standard Deviation (Sample)9.2%4.7%
Standard Deviation (Population)9.1%4.6%

Similar Demographics by High School Diploma

Demographics Similar to Sri Lankans by High School Diploma

In terms of high school diploma, the demographic groups most similar to Sri Lankans are Pennsylvania German (87.0%, a difference of 0.010%), Malaysian (87.0%, a difference of 0.010%), Black/African American (87.0%, a difference of 0.040%), Immigrants from Congo (87.0%, a difference of 0.050%), and West Indian (86.9%, a difference of 0.080%).
DemographicsRating | RankHigh School Diploma
Immigrants | Peru
0.4
/100
|
#262
Tragic
87.3%
Immigrants | South Eastern Asia
0.3
/100
|
#263
Tragic
87.2%
Jamaicans
0.3
/100
|
#264
Tragic
87.2%
U.S. Virgin Islanders
0.2
/100
|
#265
Tragic
87.1%
Immigrants | Congo
0.2
/100
|
#266
Tragic
87.0%
Blacks/African Americans
0.2
/100
|
#267
Tragic
87.0%
Pennsylvania Germans
0.2
/100
|
#268
Tragic
87.0%
Sri Lankans
0.2
/100
|
#269
Tragic
87.0%
Malaysians
0.2
/100
|
#270
Tragic
87.0%
West Indians
0.1
/100
|
#271
Tragic
86.9%
Trinidadians and Tobagonians
0.1
/100
|
#272
Tragic
86.9%
Immigrants | Jamaica
0.1
/100
|
#273
Tragic
86.9%
Bangladeshis
0.1
/100
|
#274
Tragic
86.9%
Immigrants | Trinidad and Tobago
0.1
/100
|
#275
Tragic
86.8%
Immigrants | Burma/Myanmar
0.1
/100
|
#276
Tragic
86.7%

Demographics Similar to Guamanians/Chamorros by High School Diploma

In terms of high school diploma, the demographic groups most similar to Guamanians/Chamorros are Immigrants from Eastern Africa (88.9%, a difference of 0.0%), Ethiopian (89.0%, a difference of 0.020%), Immigrants from Sudan (88.9%, a difference of 0.040%), Immigrants from Uganda (88.9%, a difference of 0.050%), and Immigrants from Syria (89.0%, a difference of 0.060%).
DemographicsRating | RankHigh School Diploma
Bolivians
45.2
/100
|
#180
Average
89.1%
Venezuelans
43.6
/100
|
#181
Average
89.1%
Spaniards
43.4
/100
|
#182
Average
89.1%
Potawatomi
42.5
/100
|
#183
Average
89.0%
Immigrants | Syria
39.2
/100
|
#184
Fair
89.0%
Ethiopians
37.0
/100
|
#185
Fair
89.0%
Immigrants | Eastern Africa
35.8
/100
|
#186
Fair
88.9%
Guamanians/Chamorros
35.5
/100
|
#187
Fair
88.9%
Immigrants | Sudan
33.4
/100
|
#188
Fair
88.9%
Immigrants | Uganda
32.6
/100
|
#189
Fair
88.9%
Immigrants | Chile
31.9
/100
|
#190
Fair
88.9%
Immigrants | Ethiopia
30.9
/100
|
#191
Fair
88.9%
Moroccans
29.5
/100
|
#192
Fair
88.8%
Immigrants | Oceania
26.9
/100
|
#193
Fair
88.8%
Immigrants | Venezuela
25.8
/100
|
#194
Fair
88.8%