Spanish vs Immigrants from Pakistan 3rd Grade

COMPARE

Spanish
Race
Ancestry
AfghanAfricanAlaska NativeAlaskan AthabascanAlbanianAleutAlsatianAmericanApacheArabArapahoArgentineanArmenianAssyrian/Chaldean/SyriacAustralianAustrianBahamianBangladeshiBarbadianBasqueBelgianBelizeanBermudanBhutaneseBlackfeetBolivianBrazilianBritishBritish West IndianBulgarianBurmeseCajunCambodianCanadianCape VerdeanCarpatho RusynCelticCentral AmericanCentral American IndianCherokeeCheyenneChickasawChileanChineseChippewaChoctawColombianColvilleComancheCosta RicanCreeCreekCroatianCrowCubanCypriotCzechCzechoslovakianDanishDelawareDominicanDutchDutch West IndianEastern EuropeanEcuadorianEgyptianEnglishEstonianEthiopianEuropeanFijianFilipinoFinnishFrenchFrench American IndianFrench CanadianGermanGerman RussianGhanaianGreekGuamanian/ChamorroGuatemalanGuyaneseHaitianHmongHonduranHopiHoumaHungarianIcelanderIndian (Asian)IndonesianInupiatIranianIraqiIrishIroquoisIsraeliItalianJamaicanJapaneseJordanianKenyanKiowaKoreanLaotianLatvianLebaneseLiberianLithuanianLumbeeLuxembourgerMacedonianMalaysianMalteseMarshalleseMenomineeMexicanMexican American IndianMongolianMoroccanNative HawaiianNavajoNepaleseNew ZealanderNicaraguanNigerianNorthern EuropeanNorwegianOkinawanOsageOttawaPaiutePakistaniPalestinianPanamanianParaguayanPennsylvania GermanPeruvianPimaPolishPortuguesePotawatomiPuebloPuerto RicanPuget Sound SalishRomanianRussianSalvadoranSamoanScandinavianScotch-IrishScottishSeminoleSenegaleseSerbianShoshoneSierra LeoneanSiouxSlavicSlovakSloveneSomaliSouth AfricanSouth AmericanSouth American IndianSoviet UnionSpaniardSpanishSpanish AmericanSpanish American IndianSri LankanSubsaharan AfricanSudaneseSwedishSwissSyrianTaiwaneseThaiTlingit-HaidaTohono O'OdhamTonganTrinidadian and TobagonianTsimshianTurkishU.S. Virgin IslanderUgandanUkrainianUruguayanUteVenezuelanVietnameseWelshWest IndianYakamaYaquiYugoslavianYumanYup'ikZimbabwean
Immigration
NonimmigrantsImmigrantsAfghanistanAfricaAlbaniaArgentinaArmeniaAsiaAustraliaAustriaBahamasBangladeshBarbadosBelarusBelgiumBelizeBoliviaBosnia and HerzegovinaBrazilBulgariaBurma/MyanmarCabo VerdeCambodiaCameroonCanadaCaribbeanCentral AmericaChileChinaColombiaCongoCosta RicaCroatiaCubaCzechoslovakiaDenmarkDominicaDominican RepublicEastern AfricaEastern AsiaEastern EuropeEcuadorEgyptEl SalvadorEnglandEritreaEthiopiaEuropeFijiFranceGermanyGhanaGreeceGrenadaGuatemalaGuyanaHaitiHondurasHong KongHungaryIndiaIndonesiaIranIraqIrelandIsraelItalyJamaicaJapanJordanKazakhstanKenyaKoreaKuwaitLaosLatin AmericaLatviaLebanonLiberiaLithuaniaMalaysiaMexicoMicronesiaMiddle AfricaMoldovaMoroccoNepalNetherlandsNicaraguaNigeriaNorth AmericaNorth MacedoniaNorthern AfricaNorthern EuropeNorwayOceaniaPanamaPeruPhilippinesPolandPortugalRomaniaRussiaSaudi ArabiaScotlandSenegalSerbiaSierra LeoneSingaporeSomaliaSouth AfricaSouth AmericaSouth Central AsiaSouth Eastern AsiaSouthern EuropeSpainSri LankaSt. Vincent and the GrenadinesSudanSwedenSwitzerlandSyriaTaiwanThailandTrinidad and TobagoTurkeyUgandaUkraineUruguayUzbekistanVenezuelaVietnamWest IndiesWestern AfricaWestern AsiaWestern EuropeYemenZaireZimbabweAzores
Immigrants from Pakistan
Race
Ancestry
AfghanAfricanAlaska NativeAlaskan AthabascanAlbanianAleutAlsatianAmericanApacheArabArapahoArgentineanArmenianAssyrian/Chaldean/SyriacAustralianAustrianBahamianBangladeshiBarbadianBasqueBelgianBelizeanBermudanBhutaneseBlackfeetBolivianBrazilianBritishBritish West IndianBulgarianBurmeseCajunCambodianCanadianCape VerdeanCarpatho RusynCelticCentral AmericanCentral American IndianCherokeeCheyenneChickasawChileanChineseChippewaChoctawColombianColvilleComancheCosta RicanCreeCreekCroatianCrowCubanCypriotCzechCzechoslovakianDanishDelawareDominicanDutchDutch West IndianEastern EuropeanEcuadorianEgyptianEnglishEstonianEthiopianEuropeanFijianFilipinoFinnishFrenchFrench American IndianFrench CanadianGermanGerman RussianGhanaianGreekGuamanian/ChamorroGuatemalanGuyaneseHaitianHmongHonduranHopiHoumaHungarianIcelanderIndian (Asian)IndonesianInupiatIranianIraqiIrishIroquoisIsraeliItalianJamaicanJapaneseJordanianKenyanKiowaKoreanLaotianLatvianLebaneseLiberianLithuanianLumbeeLuxembourgerMacedonianMalaysianMalteseMarshalleseMenomineeMexicanMexican American IndianMongolianMoroccanNative HawaiianNavajoNepaleseNew ZealanderNicaraguanNigerianNorthern EuropeanNorwegianOkinawanOsageOttawaPaiutePakistaniPalestinianPanamanianParaguayanPennsylvania GermanPeruvianPimaPolishPortuguesePotawatomiPuebloPuerto RicanPuget Sound SalishRomanianRussianSalvadoranSamoanScandinavianScotch-IrishScottishSeminoleSenegaleseSerbianShoshoneSierra LeoneanSiouxSlavicSlovakSloveneSomaliSouth AfricanSouth AmericanSouth American IndianSoviet UnionSpaniardSpanish AmericanSpanish American IndianSri LankanSubsaharan AfricanSudaneseSwedishSwissSyrianTaiwaneseThaiTlingit-HaidaTohono O'OdhamTonganTrinidadian and TobagonianTsimshianTurkishU.S. Virgin IslanderUgandanUkrainianUruguayanUteVenezuelanVietnameseWelshWest IndianYakamaYaquiYugoslavianYumanYup'ikZimbabwean
Immigration
NonimmigrantsImmigrantsAfghanistanAfricaAlbaniaArgentinaArmeniaAsiaAustraliaAustriaBahamasBangladeshBarbadosBelarusBelgiumBelizeBoliviaBosnia and HerzegovinaBrazilBulgariaBurma/MyanmarCabo VerdeCambodiaCameroonCanadaCaribbeanCentral AmericaChileChinaColombiaCongoCosta RicaCroatiaCubaCzechoslovakiaDenmarkDominicaDominican RepublicEastern AfricaEastern AsiaEastern EuropeEcuadorEgyptEl SalvadorEnglandEritreaEthiopiaEuropeFijiFranceGermanyGhanaGreeceGrenadaGuatemalaGuyanaHaitiHondurasHong KongHungaryIndiaIndonesiaIranIraqIrelandIsraelItalyJamaicaJapanJordanKazakhstanKenyaKoreaKuwaitLaosLatin AmericaLatviaLebanonLiberiaLithuaniaMalaysiaMexicoMicronesiaMiddle AfricaMoldovaMoroccoNepalNetherlandsNicaraguaNigeriaNorth AmericaNorth MacedoniaNorthern AfricaNorthern EuropeNorwayOceaniaPakistanPanamaPeruPhilippinesPolandPortugalRomaniaRussiaSaudi ArabiaScotlandSenegalSerbiaSierra LeoneSingaporeSomaliaSouth AfricaSouth AmericaSouth Central AsiaSouth Eastern AsiaSouthern EuropeSpainSri LankaSt. Vincent and the GrenadinesSudanSwedenSwitzerlandSyriaTaiwanThailandTrinidad and TobagoTurkeyUgandaUkraineUruguayUzbekistanVenezuelaVietnamWest IndiesWestern AfricaWestern AsiaWestern EuropeYemenZaireZimbabweAzores
3rd Grade
Income
Poverty
Unemployment
Labor Participation
Family Structure
Vehicle Availability
Education Level
Disability

3rd Grade Comparison

Spanish

Immigrants from Pakistan

Exceptional
Tragic
98.0%
3RD GRADE
94.8/ 100
METRIC RATING
119th/ 347
METRIC RANK
97.5%
3RD GRADE
2.7/ 100
METRIC RATING
230th/ 347
METRIC RANK

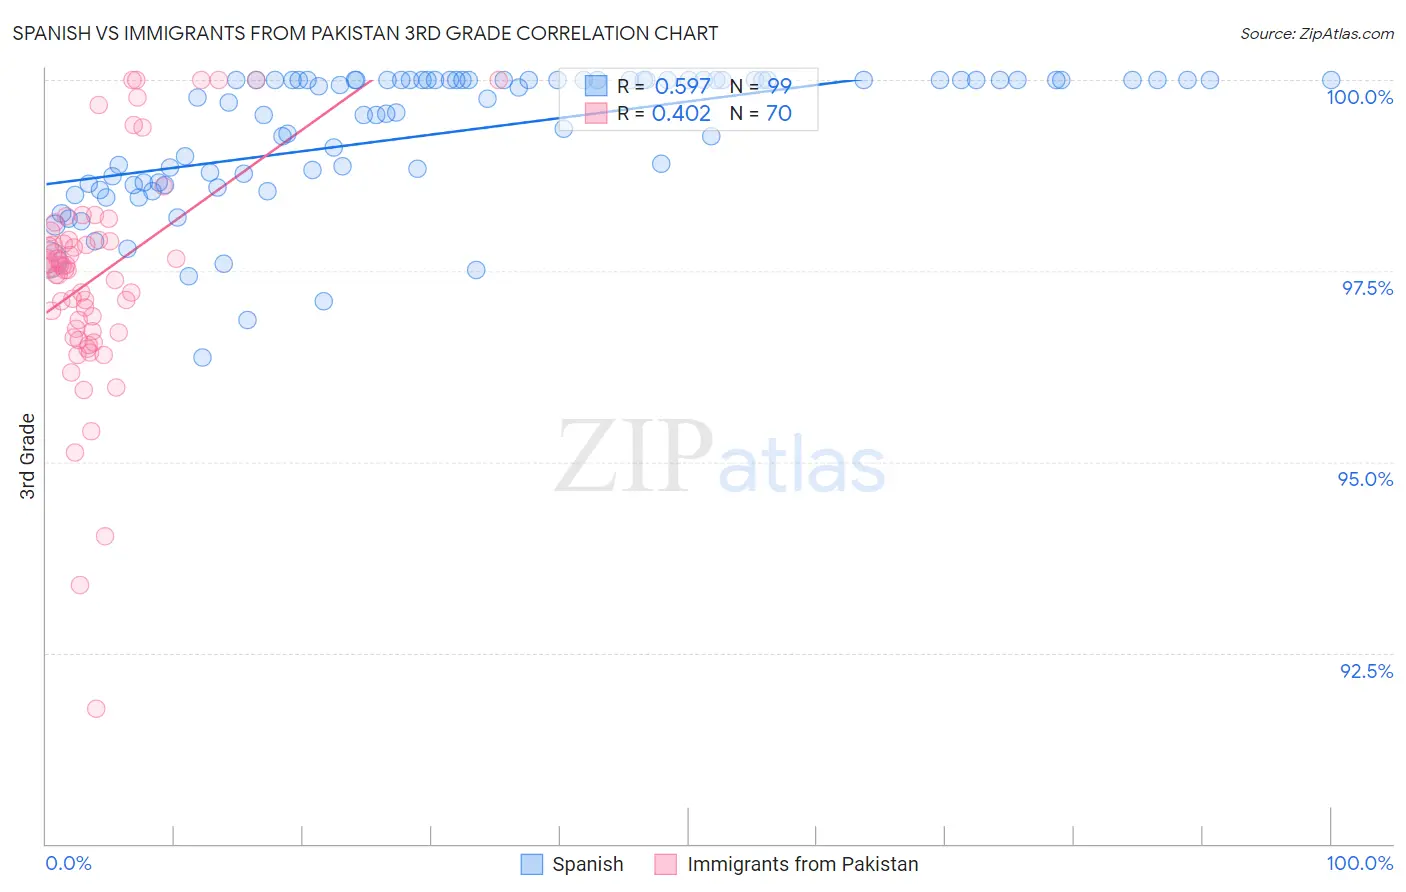
Spanish vs Immigrants from Pakistan 3rd Grade Correlation Chart

The statistical analysis conducted on geographies consisting of 422,189,210 people shows a substantial positive correlation between the proportion of Spanish and percentage of population with at least 3rd grade education in the United States with a correlation coefficient (R) of 0.597 and weighted average of 98.0%. Similarly, the statistical analysis conducted on geographies consisting of 283,900,606 people shows a moderate positive correlation between the proportion of Immigrants from Pakistan and percentage of population with at least 3rd grade education in the United States with a correlation coefficient (R) of 0.402 and weighted average of 97.5%, a difference of 0.55%.
Spanish vs Immigrants from Pakistan 3rd Grade

3rd Grade Correlation Summary

MeasurementSpanishImmigrants from Pakistan
Minimum96.4%91.8%
Maximum100.0%100.0%
Range3.6%8.2%
Mean99.3%97.4%
Median99.9%97.6%
Interquartile 25% (IQ1)98.7%96.7%
Interquartile 75% (IQ3)100.0%97.9%
Interquartile Range (IQR)1.3%1.2%
Standard Deviation (Sample)0.88%1.5%
Standard Deviation (Population)0.88%1.5%

Similar Demographics by 3rd Grade

Demographics Similar to Spanish by 3rd Grade

In terms of 3rd grade, the demographic groups most similar to Spanish are Iranian (98.0%, a difference of 0.0%), Thai (98.0%, a difference of 0.010%), Menominee (98.0%, a difference of 0.010%), Okinawan (98.0%, a difference of 0.010%), and Immigrants from Norway (98.0%, a difference of 0.010%).
DemographicsRating | Rank3rd Grade
Immigrants | Latvia
96.0
/100
|
#112
Exceptional
98.0%
Thais
95.5
/100
|
#113
Exceptional
98.0%
Menominee
95.4
/100
|
#114
Exceptional
98.0%
Okinawans
95.2
/100
|
#115
Exceptional
98.0%
Immigrants | Norway
95.2
/100
|
#116
Exceptional
98.0%
Immigrants | France
95.1
/100
|
#117
Exceptional
98.0%
Iranians
94.9
/100
|
#118
Exceptional
98.0%
Spanish
94.8
/100
|
#119
Exceptional
98.0%
Immigrants | Croatia
94.4
/100
|
#120
Exceptional
98.0%
Iroquois
94.1
/100
|
#121
Exceptional
98.0%
Lebanese
94.1
/100
|
#122
Exceptional
98.0%
Syrians
93.8
/100
|
#123
Exceptional
98.0%
Immigrants | Japan
93.7
/100
|
#124
Exceptional
98.0%
Immigrants | Saudi Arabia
93.5
/100
|
#125
Exceptional
98.0%
Immigrants | Zimbabwe
93.4
/100
|
#126
Exceptional
98.0%

Demographics Similar to Immigrants from Pakistan by 3rd Grade

In terms of 3rd grade, the demographic groups most similar to Immigrants from Pakistan are Immigrants from Costa Rica (97.5%, a difference of 0.0%), Subsaharan African (97.5%, a difference of 0.010%), Senegalese (97.5%, a difference of 0.010%), Immigrants from Western Asia (97.5%, a difference of 0.010%), and Immigrants from Malaysia (97.5%, a difference of 0.010%).
DemographicsRating | Rank3rd Grade
Immigrants | Syria
4.4
/100
|
#223
Tragic
97.5%
Bahamians
4.4
/100
|
#224
Tragic
97.5%
Tongans
4.3
/100
|
#225
Tragic
97.5%
Sudanese
4.1
/100
|
#226
Tragic
97.5%
Immigrants | Sudan
3.4
/100
|
#227
Tragic
97.5%
Sub-Saharan Africans
3.2
/100
|
#228
Tragic
97.5%
Senegalese
3.0
/100
|
#229
Tragic
97.5%
Immigrants | Pakistan
2.7
/100
|
#230
Tragic
97.5%
Immigrants | Costa Rica
2.7
/100
|
#231
Tragic
97.5%
Immigrants | Western Asia
2.6
/100
|
#232
Tragic
97.5%
Immigrants | Malaysia
2.4
/100
|
#233
Tragic
97.5%
Immigrants | Eastern Asia
1.9
/100
|
#234
Tragic
97.4%
Immigrants | Iraq
1.8
/100
|
#235
Tragic
97.4%
Liberians
1.8
/100
|
#236
Tragic
97.4%
Colombians
1.8
/100
|
#237
Tragic
97.4%