Spanish American vs Taiwanese Doctorate Degree

COMPARE

Spanish American
Race
Ancestry
AfghanAfricanAlaska NativeAlaskan AthabascanAlbanianAleutAlsatianAmericanApacheArabArapahoArgentineanArmenianAssyrian/Chaldean/SyriacAustralianAustrianBahamianBangladeshiBarbadianBasqueBelgianBelizeanBermudanBhutaneseBlackfeetBolivianBrazilianBritishBritish West IndianBulgarianBurmeseCajunCambodianCanadianCape VerdeanCarpatho RusynCelticCentral AmericanCentral American IndianCherokeeCheyenneChickasawChileanChineseChippewaChoctawColombianColvilleComancheCosta RicanCreeCreekCroatianCrowCubanCypriotCzechCzechoslovakianDanishDelawareDominicanDutchDutch West IndianEastern EuropeanEcuadorianEgyptianEnglishEstonianEthiopianEuropeanFijianFilipinoFinnishFrenchFrench American IndianFrench CanadianGermanGerman RussianGhanaianGreekGuamanian/ChamorroGuatemalanGuyaneseHaitianHmongHonduranHopiHoumaHungarianIcelanderIndian (Asian)IndonesianInupiatIranianIraqiIrishIroquoisIsraeliItalianJamaicanJapaneseJordanianKenyanKiowaKoreanLaotianLatvianLebaneseLiberianLithuanianLumbeeLuxembourgerMacedonianMalaysianMalteseMarshalleseMenomineeMexicanMexican American IndianMongolianMoroccanNative HawaiianNavajoNepaleseNew ZealanderNicaraguanNigerianNorthern EuropeanNorwegianOkinawanOsageOttawaPaiutePakistaniPalestinianPanamanianParaguayanPennsylvania GermanPeruvianPimaPolishPortuguesePotawatomiPuebloPuerto RicanPuget Sound SalishRomanianRussianSalvadoranSamoanScandinavianScotch-IrishScottishSeminoleSenegaleseSerbianShoshoneSierra LeoneanSiouxSlavicSlovakSloveneSomaliSouth AfricanSouth AmericanSouth American IndianSoviet UnionSpaniardSpanishSpanish AmericanSpanish American IndianSri LankanSubsaharan AfricanSudaneseSwedishSwissSyrianThaiTlingit-HaidaTohono O'OdhamTonganTrinidadian and TobagonianTsimshianTurkishU.S. Virgin IslanderUgandanUkrainianUruguayanUteVenezuelanVietnameseWelshWest IndianYakamaYaquiYugoslavianYumanYup'ikZimbabwean
Immigration
NonimmigrantsImmigrantsAfghanistanAfricaAlbaniaArgentinaArmeniaAsiaAustraliaAustriaBahamasBangladeshBarbadosBelarusBelgiumBelizeBoliviaBosnia and HerzegovinaBrazilBulgariaBurma/MyanmarCabo VerdeCambodiaCameroonCanadaCaribbeanCentral AmericaChileChinaColombiaCongoCosta RicaCroatiaCubaCzechoslovakiaDenmarkDominicaDominican RepublicEastern AfricaEastern AsiaEastern EuropeEcuadorEgyptEl SalvadorEnglandEritreaEthiopiaEuropeFijiFranceGermanyGhanaGreeceGrenadaGuatemalaGuyanaHaitiHondurasHong KongHungaryIndiaIndonesiaIranIraqIrelandIsraelItalyJamaicaJapanJordanKazakhstanKenyaKoreaKuwaitLaosLatin AmericaLatviaLebanonLiberiaLithuaniaMalaysiaMexicoMicronesiaMiddle AfricaMoldovaMoroccoNepalNetherlandsNicaraguaNigeriaNorth AmericaNorth MacedoniaNorthern AfricaNorthern EuropeNorwayOceaniaPakistanPanamaPeruPhilippinesPolandPortugalRomaniaRussiaSaudi ArabiaScotlandSenegalSerbiaSierra LeoneSingaporeSomaliaSouth AfricaSouth AmericaSouth Central AsiaSouth Eastern AsiaSouthern EuropeSpainSri LankaSt. Vincent and the GrenadinesSudanSwedenSwitzerlandSyriaTaiwanThailandTrinidad and TobagoTurkeyUgandaUkraineUruguayUzbekistanVenezuelaVietnamWest IndiesWestern AfricaWestern AsiaWestern EuropeYemenZaireZimbabweAzores
Taiwanese
Race
Ancestry
AfghanAfricanAlaska NativeAlaskan AthabascanAlbanianAleutAlsatianAmericanApacheArabArapahoArgentineanArmenianAssyrian/Chaldean/SyriacAustralianAustrianBahamianBangladeshiBarbadianBasqueBelgianBelizeanBermudanBhutaneseBlackfeetBolivianBrazilianBritishBritish West IndianBulgarianBurmeseCajunCambodianCanadianCape VerdeanCarpatho RusynCelticCentral AmericanCentral American IndianCherokeeCheyenneChickasawChileanChineseChippewaChoctawColombianColvilleComancheCosta RicanCreeCreekCroatianCrowCubanCypriotCzechCzechoslovakianDanishDelawareDominicanDutchDutch West IndianEastern EuropeanEcuadorianEgyptianEnglishEstonianEthiopianEuropeanFijianFilipinoFinnishFrenchFrench American IndianFrench CanadianGermanGerman RussianGhanaianGreekGuamanian/ChamorroGuatemalanGuyaneseHaitianHmongHonduranHopiHoumaHungarianIcelanderIndian (Asian)IndonesianInupiatIranianIraqiIrishIroquoisIsraeliItalianJamaicanJapaneseJordanianKenyanKiowaKoreanLaotianLatvianLebaneseLiberianLithuanianLumbeeLuxembourgerMacedonianMalaysianMalteseMarshalleseMenomineeMexicanMexican American IndianMongolianMoroccanNative HawaiianNavajoNepaleseNew ZealanderNicaraguanNigerianNorthern EuropeanNorwegianOkinawanOsageOttawaPaiutePakistaniPalestinianPanamanianParaguayanPennsylvania GermanPeruvianPimaPolishPortuguesePotawatomiPuebloPuerto RicanPuget Sound SalishRomanianRussianSalvadoranSamoanScandinavianScotch-IrishScottishSeminoleSenegaleseSerbianShoshoneSierra LeoneanSiouxSlavicSlovakSloveneSomaliSouth AfricanSouth AmericanSouth American IndianSoviet UnionSpaniardSpanishSpanish American IndianSri LankanSubsaharan AfricanSudaneseSwedishSwissSyrianTaiwaneseThaiTlingit-HaidaTohono O'OdhamTonganTrinidadian and TobagonianTsimshianTurkishU.S. Virgin IslanderUgandanUkrainianUruguayanUteVenezuelanVietnameseWelshWest IndianYakamaYaquiYugoslavianYumanYup'ikZimbabwean
Immigration
NonimmigrantsImmigrantsAfghanistanAfricaAlbaniaArgentinaArmeniaAsiaAustraliaAustriaBahamasBangladeshBarbadosBelarusBelgiumBelizeBoliviaBosnia and HerzegovinaBrazilBulgariaBurma/MyanmarCabo VerdeCambodiaCameroonCanadaCaribbeanCentral AmericaChileChinaColombiaCongoCosta RicaCroatiaCubaCzechoslovakiaDenmarkDominicaDominican RepublicEastern AfricaEastern AsiaEastern EuropeEcuadorEgyptEl SalvadorEnglandEritreaEthiopiaEuropeFijiFranceGermanyGhanaGreeceGrenadaGuatemalaGuyanaHaitiHondurasHong KongHungaryIndiaIndonesiaIranIraqIrelandIsraelItalyJamaicaJapanJordanKazakhstanKenyaKoreaKuwaitLaosLatin AmericaLatviaLebanonLiberiaLithuaniaMalaysiaMexicoMicronesiaMiddle AfricaMoldovaMoroccoNepalNetherlandsNicaraguaNigeriaNorth AmericaNorth MacedoniaNorthern AfricaNorthern EuropeNorwayOceaniaPakistanPanamaPeruPhilippinesPolandPortugalRomaniaRussiaSaudi ArabiaScotlandSenegalSerbiaSierra LeoneSingaporeSomaliaSouth AfricaSouth AmericaSouth Central AsiaSouth Eastern AsiaSouthern EuropeSpainSri LankaSt. Vincent and the GrenadinesSudanSwedenSwitzerlandSyriaTaiwanThailandTrinidad and TobagoTurkeyUgandaUkraineUruguayUzbekistanVenezuelaVietnamWest IndiesWestern AfricaWestern AsiaWestern EuropeYemenZaireZimbabweAzores
Doctorate Degree
Income
Poverty
Unemployment
Labor Participation
Family Structure
Vehicle Availability
Education Level
Disability

Doctorate Degree Comparison

Spanish Americans

Taiwanese

Poor
Exceptional
1.7%
DOCTORATE DEGREE
12.9/ 100
METRIC RATING
217th/ 347
METRIC RANK
2.1%
DOCTORATE DEGREE
96.7/ 100
METRIC RATING
115th/ 347
METRIC RANK

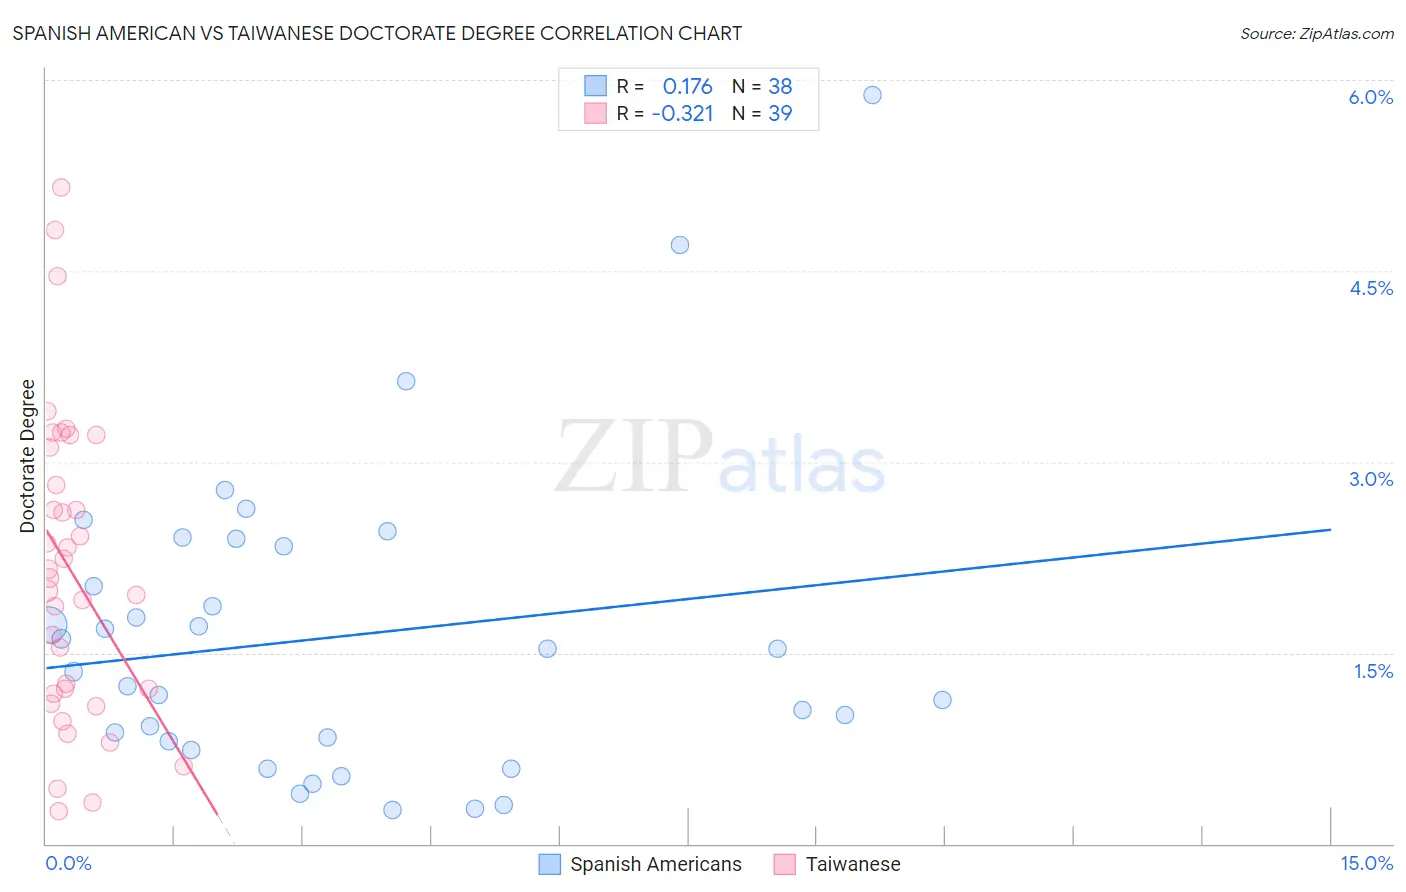
Spanish American vs Taiwanese Doctorate Degree Correlation Chart

The statistical analysis conducted on geographies consisting of 102,813,703 people shows a poor positive correlation between the proportion of Spanish Americans and percentage of population with at least doctorate degree education in the United States with a correlation coefficient (R) of 0.176 and weighted average of 1.7%. Similarly, the statistical analysis conducted on geographies consisting of 31,440,416 people shows a mild negative correlation between the proportion of Taiwanese and percentage of population with at least doctorate degree education in the United States with a correlation coefficient (R) of -0.321 and weighted average of 2.1%, a difference of 20.8%.
Spanish American vs Taiwanese Doctorate Degree

Doctorate Degree Correlation Summary

MeasurementSpanish AmericanTaiwanese
Minimum0.26%0.25%
Maximum5.9%5.2%
Range5.6%4.9%
Mean1.6%2.1%
Median1.4%2.1%
Interquartile 25% (IQ1)0.80%1.2%
Interquartile 75% (IQ3)2.3%3.1%
Interquartile Range (IQR)1.5%1.9%
Standard Deviation (Sample)1.2%1.2%
Standard Deviation (Population)1.2%1.2%

Similar Demographics by Doctorate Degree

Demographics Similar to Spanish Americans by Doctorate Degree

In terms of doctorate degree, the demographic groups most similar to Spanish Americans are Immigrants from Burma/Myanmar (1.7%, a difference of 0.21%), Alaskan Athabascan (1.7%, a difference of 0.31%), Tlingit-Haida (1.7%, a difference of 0.37%), Korean (1.7%, a difference of 0.45%), and Pueblo (1.7%, a difference of 0.45%).
DemographicsRating | RankDoctorate Degree
Tongans
15.1
/100
|
#210
Poor
1.7%
Immigrants | Armenia
15.1
/100
|
#211
Poor
1.7%
Immigrants | South Eastern Asia
14.7
/100
|
#212
Poor
1.7%
Koreans
14.2
/100
|
#213
Poor
1.7%
Pueblo
14.2
/100
|
#214
Poor
1.7%
Alaskan Athabascans
13.8
/100
|
#215
Poor
1.7%
Immigrants | Burma/Myanmar
13.5
/100
|
#216
Poor
1.7%
Spanish Americans
12.9
/100
|
#217
Poor
1.7%
Tlingit-Haida
11.9
/100
|
#218
Poor
1.7%
Immigrants | Iraq
10.7
/100
|
#219
Poor
1.7%
Immigrants | Uruguay
9.2
/100
|
#220
Tragic
1.7%
Immigrants | Nonimmigrants
8.8
/100
|
#221
Tragic
1.7%
Immigrants | Venezuela
8.7
/100
|
#222
Tragic
1.7%
Immigrants | Bosnia and Herzegovina
7.8
/100
|
#223
Tragic
1.7%
Immigrants | Poland
7.4
/100
|
#224
Tragic
1.7%

Demographics Similar to Taiwanese by Doctorate Degree

In terms of doctorate degree, the demographic groups most similar to Taiwanese are Immigrants from Croatia (2.1%, a difference of 0.080%), Immigrants from Italy (2.1%, a difference of 0.23%), Syrian (2.1%, a difference of 0.44%), Immigrants from Pakistan (2.1%, a difference of 0.46%), and Maltese (2.1%, a difference of 0.46%).
DemographicsRating | RankDoctorate Degree
Immigrants | Germany
97.3
/100
|
#108
Exceptional
2.1%
Ukrainians
97.2
/100
|
#109
Exceptional
2.1%
Brazilians
97.2
/100
|
#110
Exceptional
2.1%
Immigrants | Pakistan
97.1
/100
|
#111
Exceptional
2.1%
Syrians
97.1
/100
|
#112
Exceptional
2.1%
Immigrants | Italy
96.9
/100
|
#113
Exceptional
2.1%
Immigrants | Croatia
96.8
/100
|
#114
Exceptional
2.1%
Taiwanese
96.7
/100
|
#115
Exceptional
2.1%
Maltese
96.2
/100
|
#116
Exceptional
2.1%
Lebanese
96.0
/100
|
#117
Exceptional
2.1%
Icelanders
96.0
/100
|
#118
Exceptional
2.1%
Pakistanis
95.8
/100
|
#119
Exceptional
2.0%
Immigrants | Morocco
95.5
/100
|
#120
Exceptional
2.0%
Immigrants | Jordan
94.8
/100
|
#121
Exceptional
2.0%
Immigrants | Southern Europe
94.7
/100
|
#122
Exceptional
2.0%