Spaniard vs Yup'ik 8th Grade

COMPARE

Spaniard
Race
Ancestry
AfghanAfricanAlaska NativeAlaskan AthabascanAlbanianAleutAlsatianAmericanApacheArabArapahoArgentineanArmenianAssyrian/Chaldean/SyriacAustralianAustrianBahamianBangladeshiBarbadianBasqueBelgianBelizeanBermudanBhutaneseBlackfeetBolivianBrazilianBritishBritish West IndianBulgarianBurmeseCajunCambodianCanadianCape VerdeanCarpatho RusynCelticCentral AmericanCentral American IndianCherokeeCheyenneChickasawChileanChineseChippewaChoctawColombianColvilleComancheCosta RicanCreeCreekCroatianCrowCubanCypriotCzechCzechoslovakianDanishDelawareDominicanDutchDutch West IndianEastern EuropeanEcuadorianEgyptianEnglishEstonianEthiopianEuropeanFijianFilipinoFinnishFrenchFrench American IndianFrench CanadianGermanGerman RussianGhanaianGreekGuamanian/ChamorroGuatemalanGuyaneseHaitianHmongHonduranHopiHoumaHungarianIcelanderIndian (Asian)IndonesianInupiatIranianIraqiIrishIroquoisIsraeliItalianJamaicanJapaneseJordanianKenyanKiowaKoreanLaotianLatvianLebaneseLiberianLithuanianLumbeeLuxembourgerMacedonianMalaysianMalteseMarshalleseMenomineeMexicanMexican American IndianMongolianMoroccanNative HawaiianNavajoNepaleseNew ZealanderNicaraguanNigerianNorthern EuropeanNorwegianOkinawanOsageOttawaPaiutePakistaniPalestinianPanamanianParaguayanPennsylvania GermanPeruvianPimaPolishPortuguesePotawatomiPuebloPuerto RicanPuget Sound SalishRomanianRussianSalvadoranSamoanScandinavianScotch-IrishScottishSeminoleSenegaleseSerbianShoshoneSierra LeoneanSiouxSlavicSlovakSloveneSomaliSouth AfricanSouth AmericanSouth American IndianSoviet UnionSpaniardSpanishSpanish AmericanSpanish American IndianSri LankanSubsaharan AfricanSudaneseSwedishSwissSyrianTaiwaneseThaiTlingit-HaidaTohono O'OdhamTonganTrinidadian and TobagonianTsimshianTurkishU.S. Virgin IslanderUgandanUkrainianUruguayanUteVenezuelanVietnameseWelshWest IndianYakamaYaquiYugoslavianYumanZimbabwean
Immigration
NonimmigrantsImmigrantsAfghanistanAfricaAlbaniaArgentinaArmeniaAsiaAustraliaAustriaBahamasBangladeshBarbadosBelarusBelgiumBelizeBoliviaBosnia and HerzegovinaBrazilBulgariaBurma/MyanmarCabo VerdeCambodiaCameroonCanadaCaribbeanCentral AmericaChileChinaColombiaCongoCosta RicaCroatiaCubaCzechoslovakiaDenmarkDominicaDominican RepublicEastern AfricaEastern AsiaEastern EuropeEcuadorEgyptEl SalvadorEnglandEritreaEthiopiaEuropeFijiFranceGermanyGhanaGreeceGrenadaGuatemalaGuyanaHaitiHondurasHong KongHungaryIndiaIndonesiaIranIraqIrelandIsraelItalyJamaicaJapanJordanKazakhstanKenyaKoreaKuwaitLaosLatin AmericaLatviaLebanonLiberiaLithuaniaMalaysiaMexicoMicronesiaMiddle AfricaMoldovaMoroccoNepalNetherlandsNicaraguaNigeriaNorth AmericaNorth MacedoniaNorthern AfricaNorthern EuropeNorwayOceaniaPakistanPanamaPeruPhilippinesPolandPortugalRomaniaRussiaSaudi ArabiaScotlandSenegalSerbiaSierra LeoneSingaporeSomaliaSouth AfricaSouth AmericaSouth Central AsiaSouth Eastern AsiaSouthern EuropeSpainSri LankaSt. Vincent and the GrenadinesSudanSwedenSwitzerlandSyriaTaiwanThailandTrinidad and TobagoTurkeyUgandaUkraineUruguayUzbekistanVenezuelaVietnamWest IndiesWestern AfricaWestern AsiaWestern EuropeYemenZaireZimbabweAzores
Yup'ik
Race
Ancestry
AfghanAfricanAlaska NativeAlaskan AthabascanAlbanianAleutAlsatianAmericanApacheArabArapahoArgentineanArmenianAssyrian/Chaldean/SyriacAustralianAustrianBahamianBangladeshiBarbadianBasqueBelgianBelizeanBermudanBhutaneseBlackfeetBolivianBrazilianBritishBritish West IndianBulgarianBurmeseCajunCambodianCanadianCape VerdeanCarpatho RusynCelticCentral AmericanCentral American IndianCherokeeCheyenneChickasawChileanChineseChippewaChoctawColombianColvilleComancheCosta RicanCreeCreekCroatianCrowCubanCypriotCzechCzechoslovakianDanishDelawareDominicanDutchDutch West IndianEastern EuropeanEcuadorianEgyptianEnglishEstonianEthiopianEuropeanFijianFilipinoFinnishFrenchFrench American IndianFrench CanadianGermanGerman RussianGhanaianGreekGuamanian/ChamorroGuatemalanGuyaneseHaitianHmongHonduranHopiHoumaHungarianIcelanderIndian (Asian)IndonesianInupiatIranianIraqiIrishIroquoisIsraeliItalianJamaicanJapaneseJordanianKenyanKiowaKoreanLaotianLatvianLebaneseLiberianLithuanianLumbeeLuxembourgerMacedonianMalaysianMalteseMarshalleseMenomineeMexicanMexican American IndianMongolianMoroccanNative HawaiianNavajoNepaleseNew ZealanderNicaraguanNigerianNorthern EuropeanNorwegianOkinawanOsageOttawaPaiutePakistaniPalestinianPanamanianParaguayanPennsylvania GermanPeruvianPimaPolishPortuguesePotawatomiPuebloPuerto RicanPuget Sound SalishRomanianRussianSalvadoranSamoanScandinavianScotch-IrishScottishSeminoleSenegaleseSerbianShoshoneSierra LeoneanSiouxSlavicSlovakSloveneSomaliSouth AfricanSouth AmericanSouth American IndianSoviet UnionSpanishSpanish AmericanSpanish American IndianSri LankanSubsaharan AfricanSudaneseSwedishSwissSyrianTaiwaneseThaiTlingit-HaidaTohono O'OdhamTonganTrinidadian and TobagonianTsimshianTurkishU.S. Virgin IslanderUgandanUkrainianUruguayanUteVenezuelanVietnameseWelshWest IndianYakamaYaquiYugoslavianYumanYup'ikZimbabwean
Immigration
NonimmigrantsImmigrantsAfghanistanAfricaAlbaniaArgentinaArmeniaAsiaAustraliaAustriaBahamasBangladeshBarbadosBelarusBelgiumBelizeBoliviaBosnia and HerzegovinaBrazilBulgariaBurma/MyanmarCabo VerdeCambodiaCameroonCanadaCaribbeanCentral AmericaChileChinaColombiaCongoCosta RicaCroatiaCubaCzechoslovakiaDenmarkDominicaDominican RepublicEastern AfricaEastern AsiaEastern EuropeEcuadorEgyptEl SalvadorEnglandEritreaEthiopiaEuropeFijiFranceGermanyGhanaGreeceGrenadaGuatemalaGuyanaHaitiHondurasHong KongHungaryIndiaIndonesiaIranIraqIrelandIsraelItalyJamaicaJapanJordanKazakhstanKenyaKoreaKuwaitLaosLatin AmericaLatviaLebanonLiberiaLithuaniaMalaysiaMexicoMicronesiaMiddle AfricaMoldovaMoroccoNepalNetherlandsNicaraguaNigeriaNorth AmericaNorth MacedoniaNorthern AfricaNorthern EuropeNorwayOceaniaPakistanPanamaPeruPhilippinesPolandPortugalRomaniaRussiaSaudi ArabiaScotlandSenegalSerbiaSierra LeoneSingaporeSomaliaSouth AfricaSouth AmericaSouth Central AsiaSouth Eastern AsiaSouthern EuropeSpainSri LankaSt. Vincent and the GrenadinesSudanSwedenSwitzerlandSyriaTaiwanThailandTrinidad and TobagoTurkeyUgandaUkraineUruguayUzbekistanVenezuelaVietnamWest IndiesWestern AfricaWestern AsiaWestern EuropeYemenZaireZimbabweAzores
8th Grade
Income
Poverty
Unemployment
Labor Participation
Family Structure
Vehicle Availability
Education Level
Disability

8th Grade Comparison

Spaniards

Yup'ik

Good
Exceptional
95.8%
8TH GRADE
60.0/ 100
METRIC RATING
167th/ 347
METRIC RANK
97.0%
8TH GRADE
100.0/ 100
METRIC RATING
32nd/ 347
METRIC RANK

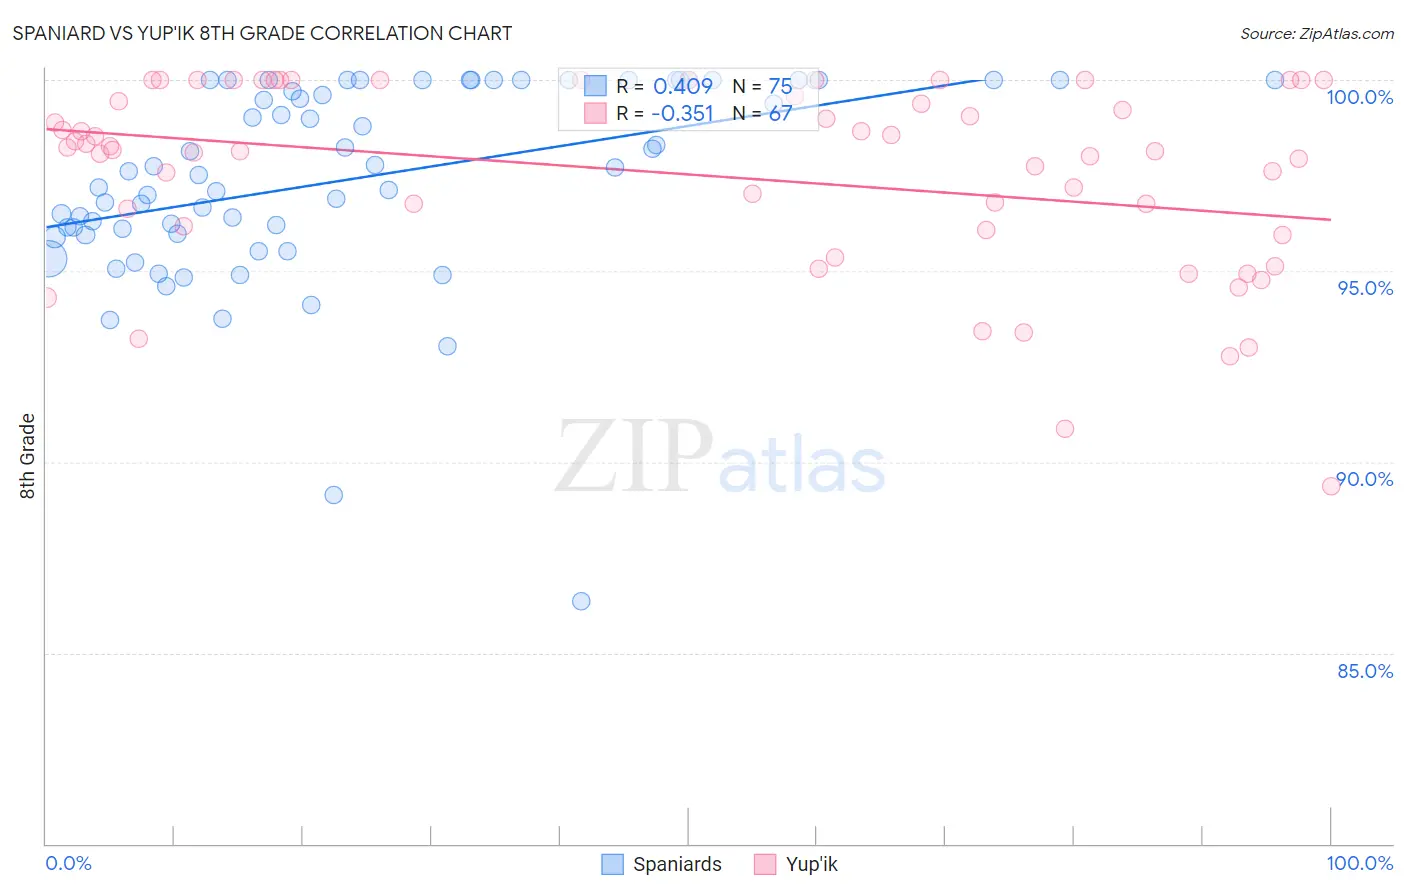
Spaniard vs Yup'ik 8th Grade Correlation Chart

The statistical analysis conducted on geographies consisting of 443,544,503 people shows a moderate positive correlation between the proportion of Spaniards and percentage of population with at least 8th grade education in the United States with a correlation coefficient (R) of 0.409 and weighted average of 95.8%. Similarly, the statistical analysis conducted on geographies consisting of 39,963,824 people shows a mild negative correlation between the proportion of Yup'ik and percentage of population with at least 8th grade education in the United States with a correlation coefficient (R) of -0.351 and weighted average of 97.0%, a difference of 1.3%.
Spaniard vs Yup'ik 8th Grade

8th Grade Correlation Summary

MeasurementSpaniardYup'ik
Minimum86.4%89.4%
Maximum100.0%100.0%
Range13.6%10.6%
Mean97.4%97.5%
Median97.6%98.2%
Interquartile 25% (IQ1)96.0%96.1%
Interquartile 75% (IQ3)100.0%100.0%
Interquartile Range (IQR)4.0%3.9%
Standard Deviation (Sample)2.6%2.5%
Standard Deviation (Population)2.6%2.5%

Similar Demographics by 8th Grade

Demographics Similar to Spaniards by 8th Grade

In terms of 8th grade, the demographic groups most similar to Spaniards are Immigrants from Ukraine (95.8%, a difference of 0.0%), Alsatian (95.8%, a difference of 0.010%), Immigrants from Poland (95.8%, a difference of 0.010%), Immigrants from Iran (95.8%, a difference of 0.010%), and Ute (95.8%, a difference of 0.010%).
DemographicsRating | Rank8th Grade
Seminole
67.7
/100
|
#160
Good
95.8%
Bermudans
67.5
/100
|
#161
Good
95.8%
Immigrants | Kenya
67.2
/100
|
#162
Good
95.8%
Immigrants | Sri Lanka
64.1
/100
|
#163
Good
95.8%
Immigrants | Italy
63.5
/100
|
#164
Good
95.8%
Alsatians
61.4
/100
|
#165
Good
95.8%
Immigrants | Poland
61.1
/100
|
#166
Good
95.8%
Spaniards
60.0
/100
|
#167
Good
95.8%
Immigrants | Ukraine
59.5
/100
|
#168
Average
95.8%
Immigrants | Iran
58.6
/100
|
#169
Average
95.8%
Ute
58.5
/100
|
#170
Average
95.8%
Egyptians
58.2
/100
|
#171
Average
95.8%
Immigrants | Korea
57.9
/100
|
#172
Average
95.8%
Mongolians
53.0
/100
|
#173
Average
95.8%
Chileans
50.0
/100
|
#174
Average
95.7%

Demographics Similar to Yup'ik by 8th Grade

In terms of 8th grade, the demographic groups most similar to Yup'ik are Swiss (97.0%, a difference of 0.010%), Sioux (97.1%, a difference of 0.030%), Chippewa (97.1%, a difference of 0.030%), Luxembourger (97.0%, a difference of 0.040%), and Alaska Native (97.0%, a difference of 0.050%).
DemographicsRating | Rank8th Grade
Czechs
100.0
/100
|
#25
Exceptional
97.1%
French
100.0
/100
|
#26
Exceptional
97.1%
Scotch-Irish
100.0
/100
|
#27
Exceptional
97.1%
Italians
100.0
/100
|
#28
Exceptional
97.1%
Europeans
100.0
/100
|
#29
Exceptional
97.1%
Sioux
100.0
/100
|
#30
Exceptional
97.1%
Chippewa
100.0
/100
|
#31
Exceptional
97.1%
Yup'ik
100.0
/100
|
#32
Exceptional
97.0%
Swiss
100.0
/100
|
#33
Exceptional
97.0%
Luxembourgers
100.0
/100
|
#34
Exceptional
97.0%
Alaska Natives
100.0
/100
|
#35
Exceptional
97.0%
Belgians
100.0
/100
|
#36
Exceptional
97.0%
Latvians
100.0
/100
|
#37
Exceptional
97.0%
British
100.0
/100
|
#38
Exceptional
97.0%
Hungarians
100.0
/100
|
#39
Exceptional
97.0%