Spaniard vs Immigrants from West Indies Nursery School
COMPARE
Spaniard
Immigrants from West Indies
Nursery School
Nursery School Comparison
Spaniards
Immigrants from West Indies
98.2%
NURSERY SCHOOL
91.1/ 100
METRIC RATING
131st/ 347
METRIC RANK
97.4%
NURSERY SCHOOL
0.0/ 100
METRIC RATING
283rd/ 347
METRIC RANK
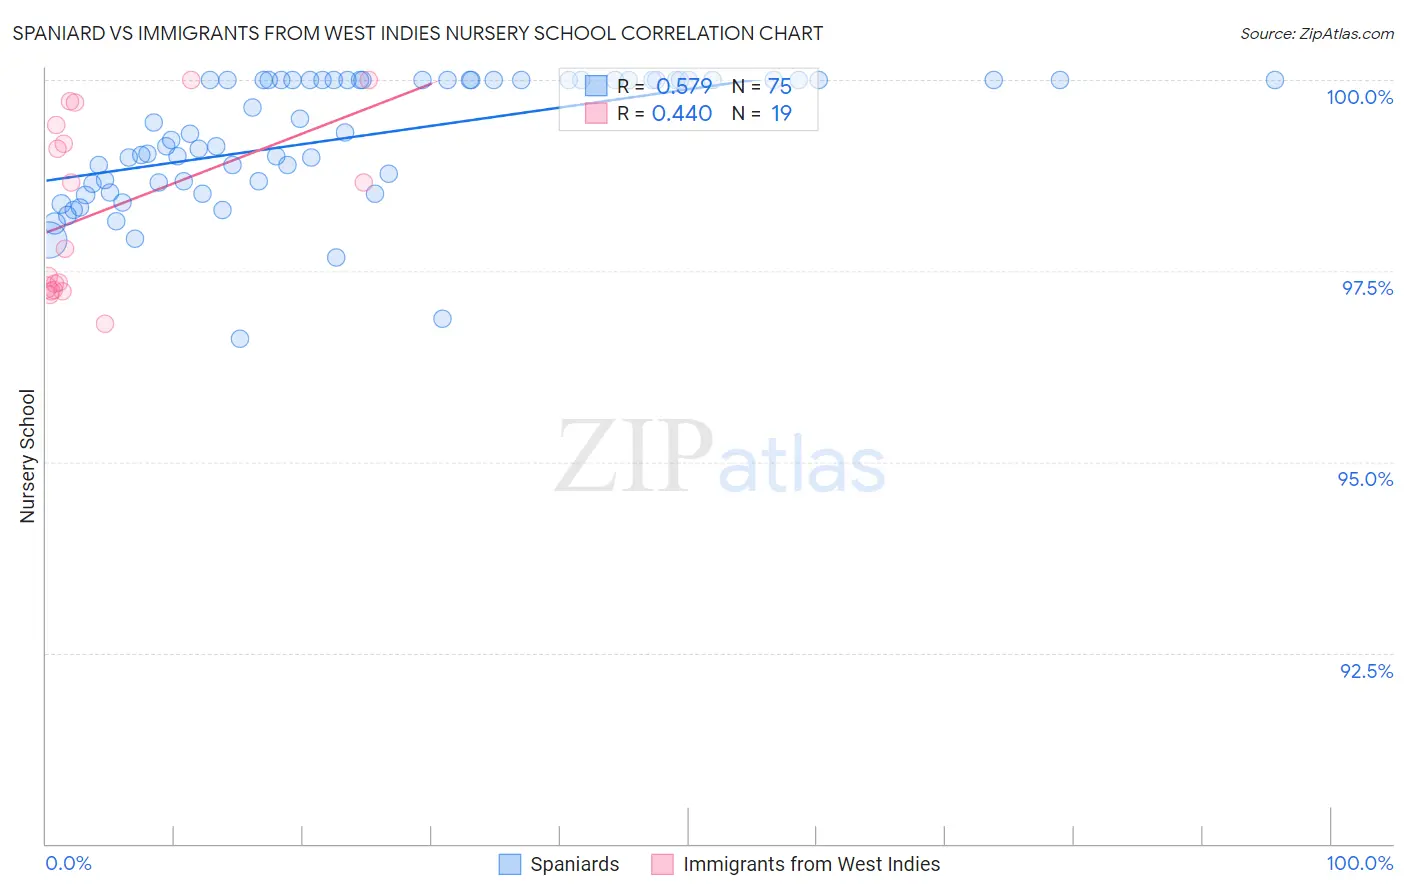
Spaniard vs Immigrants from West Indies Nursery School Correlation Chart
The statistical analysis conducted on geographies consisting of 443,544,503 people shows a substantial positive correlation between the proportion of Spaniards and percentage of population with at least nursery school education in the United States with a correlation coefficient (R) of 0.579 and weighted average of 98.2%. Similarly, the statistical analysis conducted on geographies consisting of 72,457,514 people shows a moderate positive correlation between the proportion of Immigrants from West Indies and percentage of population with at least nursery school education in the United States with a correlation coefficient (R) of 0.440 and weighted average of 97.4%, a difference of 0.79%.
Nursery School Correlation Summary
| Measurement | Spaniard | Immigrants from West Indies |
| Minimum | 96.6% | 96.8% |
| Maximum | 100.0% | 100.0% |
| Range | 3.4% | 3.2% |
| Mean | 99.3% | 98.3% |
| Median | 99.3% | 97.8% |
| Interquartile 25% (IQ1) | 98.7% | 97.2% |
| Interquartile 75% (IQ3) | 100.0% | 99.4% |
| Interquartile Range (IQR) | 1.3% | 2.2% |
| Standard Deviation (Sample) | 0.83% | 1.1% |
| Standard Deviation (Population) | 0.82% | 1.1% |
Similar Demographics by Nursery School
Demographics Similar to Spaniards by Nursery School
In terms of nursery school, the demographic groups most similar to Spaniards are Cambodian (98.2%, a difference of 0.0%), Immigrants from Croatia (98.2%, a difference of 0.0%), Seminole (98.2%, a difference of 0.0%), Immigrants from Europe (98.1%, a difference of 0.0%), and Immigrants from Serbia (98.2%, a difference of 0.010%).
| Demographics | Rating | Rank | Nursery School |
| Lebanese | 93.8 /100 | #124 | Exceptional 98.2% |
| Iroquois | 93.7 /100 | #125 | Exceptional 98.2% |
| Menominee | 93.6 /100 | #126 | Exceptional 98.2% |
| Immigrants | Saudi Arabia | 93.4 /100 | #127 | Exceptional 98.2% |
| Immigrants | Serbia | 92.4 /100 | #128 | Exceptional 98.2% |
| Cambodians | 91.4 /100 | #129 | Exceptional 98.2% |
| Immigrants | Croatia | 91.4 /100 | #130 | Exceptional 98.2% |
| Spaniards | 91.1 /100 | #131 | Exceptional 98.2% |
| Seminole | 90.9 /100 | #132 | Exceptional 98.2% |
| Immigrants | Europe | 90.7 /100 | #133 | Exceptional 98.1% |
| Immigrants | Bulgaria | 89.4 /100 | #134 | Excellent 98.1% |
| Immigrants | Hungary | 89.3 /100 | #135 | Excellent 98.1% |
| Immigrants | Kuwait | 88.9 /100 | #136 | Excellent 98.1% |
| Israelis | 88.2 /100 | #137 | Excellent 98.1% |
| Immigrants | Romania | 88.0 /100 | #138 | Excellent 98.1% |
Demographics Similar to Immigrants from West Indies by Nursery School
In terms of nursery school, the demographic groups most similar to Immigrants from West Indies are Immigrants from Trinidad and Tobago (97.4%, a difference of 0.0%), Immigrants from Barbados (97.4%, a difference of 0.020%), Immigrants from Portugal (97.4%, a difference of 0.020%), Immigrants from Hong Kong (97.4%, a difference of 0.030%), and Immigrants from Ghana (97.4%, a difference of 0.040%).
| Demographics | Rating | Rank | Nursery School |
| Immigrants | Philippines | 0.1 /100 | #276 | Tragic 97.5% |
| Immigrants | Western Africa | 0.1 /100 | #277 | Tragic 97.4% |
| Immigrants | Uzbekistan | 0.1 /100 | #278 | Tragic 97.4% |
| Immigrants | Ghana | 0.1 /100 | #279 | Tragic 97.4% |
| Barbadians | 0.0 /100 | #280 | Tragic 97.4% |
| Trinidadians and Tobagonians | 0.0 /100 | #281 | Tragic 97.4% |
| Afghans | 0.0 /100 | #282 | Tragic 97.4% |
| Immigrants | West Indies | 0.0 /100 | #283 | Tragic 97.4% |
| Immigrants | Trinidad and Tobago | 0.0 /100 | #284 | Tragic 97.4% |
| Immigrants | Barbados | 0.0 /100 | #285 | Tragic 97.4% |
| Immigrants | Portugal | 0.0 /100 | #286 | Tragic 97.4% |
| Immigrants | Hong Kong | 0.0 /100 | #287 | Tragic 97.4% |
| Immigrants | Thailand | 0.0 /100 | #288 | Tragic 97.3% |
| Immigrants | St. Vincent and the Grenadines | 0.0 /100 | #289 | Tragic 97.3% |
| Immigrants | Afghanistan | 0.0 /100 | #290 | Tragic 97.3% |