Soviet Union vs Alaska Native 10th Grade
COMPARE
Soviet Union
Alaska Native
10th Grade
10th Grade Comparison
Soviet Union
Alaska Natives
94.6%
10TH GRADE
98.3/ 100
METRIC RATING
93rd/ 347
METRIC RANK
94.9%
10TH GRADE
99.6/ 100
METRIC RATING
71st/ 347
METRIC RANK
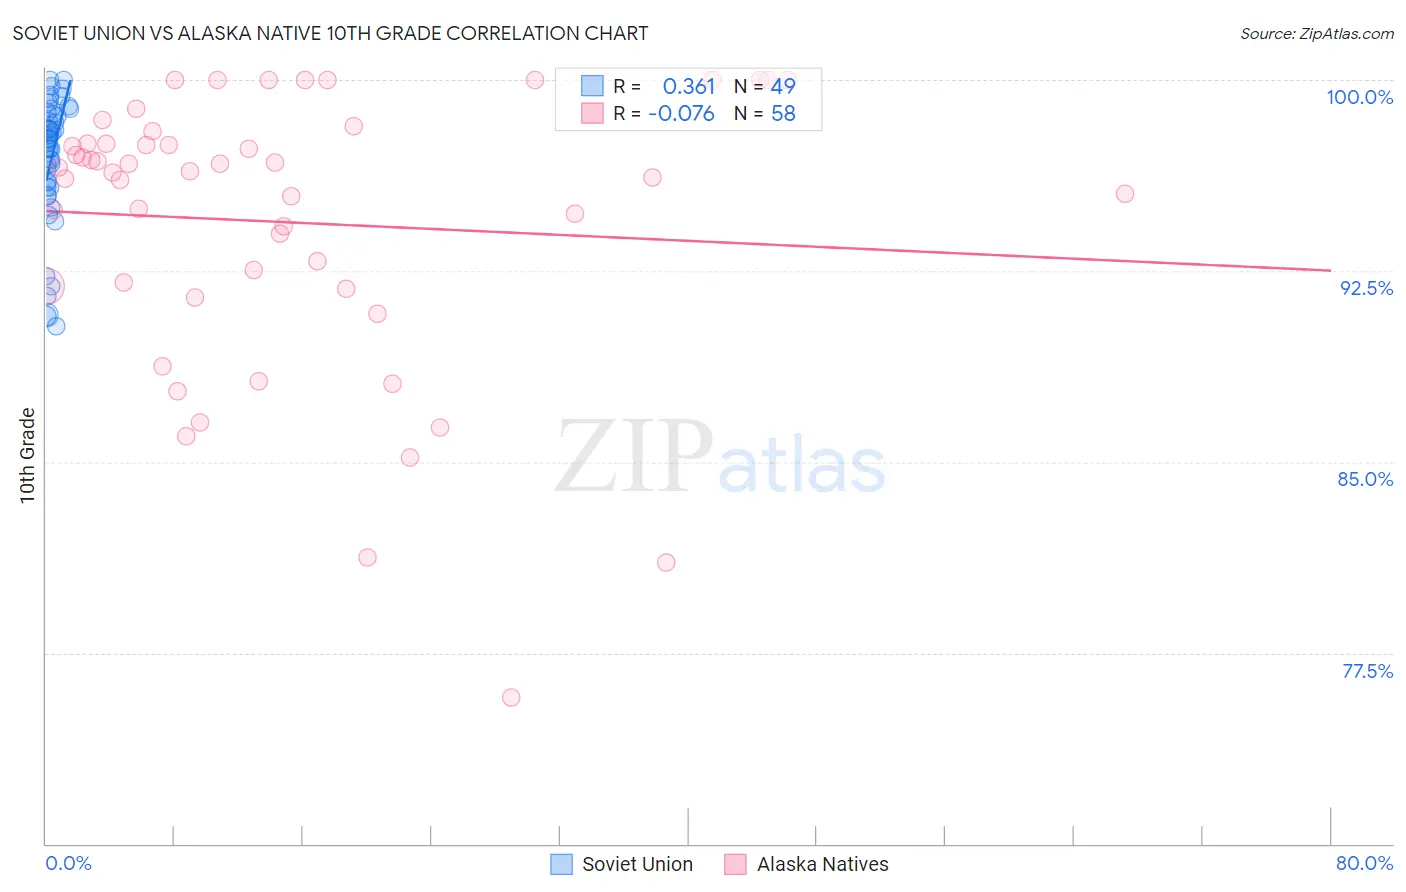
Soviet Union vs Alaska Native 10th Grade Correlation Chart
The statistical analysis conducted on geographies consisting of 43,454,395 people shows a mild positive correlation between the proportion of Soviet Union and percentage of population with at least 10th grade education in the United States with a correlation coefficient (R) of 0.361 and weighted average of 94.6%. Similarly, the statistical analysis conducted on geographies consisting of 76,778,743 people shows a slight negative correlation between the proportion of Alaska Natives and percentage of population with at least 10th grade education in the United States with a correlation coefficient (R) of -0.076 and weighted average of 94.9%, a difference of 0.32%.
10th Grade Correlation Summary
| Measurement | Soviet Union | Alaska Native |
| Minimum | 90.4% | 75.7% |
| Maximum | 100.0% | 100.0% |
| Range | 9.6% | 24.3% |
| Mean | 96.9% | 94.4% |
| Median | 97.7% | 96.4% |
| Interquartile 25% (IQ1) | 95.8% | 91.9% |
| Interquartile 75% (IQ3) | 98.7% | 97.5% |
| Interquartile Range (IQR) | 2.9% | 5.6% |
| Standard Deviation (Sample) | 2.5% | 5.4% |
| Standard Deviation (Population) | 2.5% | 5.4% |
Similar Demographics by 10th Grade
Demographics Similar to Soviet Union by 10th Grade
In terms of 10th grade, the demographic groups most similar to Soviet Union are Immigrants from Germany (94.6%, a difference of 0.0%), Yugoslavian (94.6%, a difference of 0.010%), Menominee (94.6%, a difference of 0.010%), Immigrants from Switzerland (94.6%, a difference of 0.010%), and Lebanese (94.6%, a difference of 0.010%).
| Demographics | Rating | Rank | 10th Grade |
| Puget Sound Salish | 99.0 /100 | #86 | Exceptional 94.7% |
| Immigrants | Saudi Arabia | 99.0 /100 | #87 | Exceptional 94.7% |
| Immigrants | Japan | 99.0 /100 | #88 | Exceptional 94.7% |
| Immigrants | Moldova | 98.9 /100 | #89 | Exceptional 94.7% |
| South Africans | 98.8 /100 | #90 | Exceptional 94.7% |
| Whites/Caucasians | 98.8 /100 | #91 | Exceptional 94.7% |
| Yugoslavians | 98.4 /100 | #92 | Exceptional 94.6% |
| Soviet Union | 98.3 /100 | #93 | Exceptional 94.6% |
| Immigrants | Germany | 98.3 /100 | #94 | Exceptional 94.6% |
| Menominee | 98.3 /100 | #95 | Exceptional 94.6% |
| Immigrants | Switzerland | 98.3 /100 | #96 | Exceptional 94.6% |
| Lebanese | 98.3 /100 | #97 | Exceptional 94.6% |
| Immigrants | Bulgaria | 98.1 /100 | #98 | Exceptional 94.6% |
| Immigrants | France | 97.9 /100 | #99 | Exceptional 94.5% |
| Immigrants | South Central Asia | 97.8 /100 | #100 | Exceptional 94.5% |
Demographics Similar to Alaska Natives by 10th Grade
In terms of 10th grade, the demographic groups most similar to Alaska Natives are Zimbabwean (94.9%, a difference of 0.0%), Immigrants from England (94.9%, a difference of 0.010%), Immigrants from Sweden (94.9%, a difference of 0.020%), Bhutanese (94.9%, a difference of 0.020%), and Canadian (94.9%, a difference of 0.020%).
| Demographics | Rating | Rank | 10th Grade |
| Native Hawaiians | 99.7 /100 | #64 | Exceptional 95.0% |
| Turks | 99.7 /100 | #65 | Exceptional 95.0% |
| Immigrants | Australia | 99.7 /100 | #66 | Exceptional 94.9% |
| Immigrants | Netherlands | 99.7 /100 | #67 | Exceptional 94.9% |
| Immigrants | Belgium | 99.7 /100 | #68 | Exceptional 94.9% |
| Immigrants | England | 99.6 /100 | #69 | Exceptional 94.9% |
| Zimbabweans | 99.6 /100 | #70 | Exceptional 94.9% |
| Alaska Natives | 99.6 /100 | #71 | Exceptional 94.9% |
| Immigrants | Sweden | 99.6 /100 | #72 | Exceptional 94.9% |
| Bhutanese | 99.6 /100 | #73 | Exceptional 94.9% |
| Canadians | 99.6 /100 | #74 | Exceptional 94.9% |
| Okinawans | 99.5 /100 | #75 | Exceptional 94.8% |
| Romanians | 99.5 /100 | #76 | Exceptional 94.8% |
| Immigrants | South Africa | 99.5 /100 | #77 | Exceptional 94.8% |
| Filipinos | 99.3 /100 | #78 | Exceptional 94.8% |