South African vs Guamanian/Chamorro 10th Grade

COMPARE

South African
Race
Ancestry
AfghanAfricanAlaska NativeAlaskan AthabascanAlbanianAleutAlsatianAmericanApacheArabArapahoArgentineanArmenianAssyrian/Chaldean/SyriacAustralianAustrianBahamianBangladeshiBarbadianBasqueBelgianBelizeanBermudanBhutaneseBlackfeetBolivianBrazilianBritishBritish West IndianBulgarianBurmeseCajunCambodianCanadianCape VerdeanCarpatho RusynCelticCentral AmericanCentral American IndianCherokeeCheyenneChickasawChileanChineseChippewaChoctawColombianColvilleComancheCosta RicanCreeCreekCroatianCrowCubanCypriotCzechCzechoslovakianDanishDelawareDominicanDutchDutch West IndianEastern EuropeanEcuadorianEgyptianEnglishEstonianEthiopianEuropeanFijianFilipinoFinnishFrenchFrench American IndianFrench CanadianGermanGerman RussianGhanaianGreekGuatemalanGuyaneseHaitianHmongHonduranHopiHoumaHungarianIcelanderIndian (Asian)IndonesianInupiatIranianIraqiIrishIroquoisIsraeliItalianJamaicanJapaneseJordanianKenyanKiowaKoreanLaotianLatvianLebaneseLiberianLithuanianLumbeeLuxembourgerMacedonianMalaysianMalteseMarshalleseMenomineeMexicanMexican American IndianMongolianMoroccanNative HawaiianNavajoNepaleseNew ZealanderNicaraguanNigerianNorthern EuropeanNorwegianOkinawanOsageOttawaPaiutePakistaniPalestinianPanamanianParaguayanPennsylvania GermanPeruvianPimaPolishPortuguesePotawatomiPuebloPuerto RicanPuget Sound SalishRomanianRussianSalvadoranSamoanScandinavianScotch-IrishScottishSeminoleSenegaleseSerbianShoshoneSierra LeoneanSiouxSlavicSlovakSloveneSomaliSouth AfricanSouth AmericanSouth American IndianSoviet UnionSpaniardSpanishSpanish AmericanSpanish American IndianSri LankanSubsaharan AfricanSudaneseSwedishSwissSyrianTaiwaneseThaiTlingit-HaidaTohono O'OdhamTonganTrinidadian and TobagonianTsimshianTurkishU.S. Virgin IslanderUgandanUkrainianUruguayanUteVenezuelanVietnameseWelshWest IndianYakamaYaquiYugoslavianYumanYup'ikZimbabwean
Immigration
NonimmigrantsImmigrantsAfghanistanAfricaAlbaniaArgentinaArmeniaAsiaAustraliaAustriaBahamasBangladeshBarbadosBelarusBelgiumBelizeBoliviaBosnia and HerzegovinaBrazilBulgariaBurma/MyanmarCabo VerdeCambodiaCameroonCanadaCaribbeanCentral AmericaChileChinaColombiaCongoCosta RicaCroatiaCubaCzechoslovakiaDenmarkDominicaDominican RepublicEastern AfricaEastern AsiaEastern EuropeEcuadorEgyptEl SalvadorEnglandEritreaEthiopiaEuropeFijiFranceGermanyGhanaGreeceGrenadaGuatemalaGuyanaHaitiHondurasHong KongHungaryIndiaIndonesiaIranIraqIrelandIsraelItalyJamaicaJapanJordanKazakhstanKenyaKoreaKuwaitLaosLatin AmericaLatviaLebanonLiberiaLithuaniaMalaysiaMexicoMicronesiaMiddle AfricaMoldovaMoroccoNepalNetherlandsNicaraguaNigeriaNorth AmericaNorth MacedoniaNorthern AfricaNorthern EuropeNorwayOceaniaPakistanPanamaPeruPhilippinesPolandPortugalRomaniaRussiaSaudi ArabiaScotlandSenegalSerbiaSierra LeoneSingaporeSomaliaSouth AfricaSouth AmericaSouth Central AsiaSouth Eastern AsiaSouthern EuropeSpainSri LankaSt. Vincent and the GrenadinesSudanSwedenSwitzerlandSyriaTaiwanThailandTrinidad and TobagoTurkeyUgandaUkraineUruguayUzbekistanVenezuelaVietnamWest IndiesWestern AfricaWestern AsiaWestern EuropeYemenZaireZimbabweAzores
Guamanian/Chamorro
Race
Ancestry
AfghanAfricanAlaska NativeAlaskan AthabascanAlbanianAleutAlsatianAmericanApacheArabArapahoArgentineanArmenianAssyrian/Chaldean/SyriacAustralianAustrianBahamianBangladeshiBarbadianBasqueBelgianBelizeanBermudanBhutaneseBlackfeetBolivianBrazilianBritishBritish West IndianBulgarianBurmeseCajunCambodianCanadianCape VerdeanCarpatho RusynCelticCentral AmericanCentral American IndianCherokeeCheyenneChickasawChileanChineseChippewaChoctawColombianColvilleComancheCosta RicanCreeCreekCroatianCrowCubanCypriotCzechCzechoslovakianDanishDelawareDominicanDutchDutch West IndianEastern EuropeanEcuadorianEgyptianEnglishEstonianEthiopianEuropeanFijianFilipinoFinnishFrenchFrench American IndianFrench CanadianGermanGerman RussianGhanaianGreekGuamanian/ChamorroGuatemalanGuyaneseHaitianHmongHonduranHopiHoumaHungarianIcelanderIndian (Asian)IndonesianInupiatIranianIraqiIrishIroquoisIsraeliItalianJamaicanJapaneseJordanianKenyanKiowaKoreanLaotianLatvianLebaneseLiberianLithuanianLumbeeLuxembourgerMacedonianMalaysianMalteseMarshalleseMenomineeMexicanMexican American IndianMongolianMoroccanNative HawaiianNavajoNepaleseNew ZealanderNicaraguanNigerianNorthern EuropeanNorwegianOkinawanOsageOttawaPaiutePakistaniPalestinianPanamanianParaguayanPennsylvania GermanPeruvianPimaPolishPortuguesePotawatomiPuebloPuerto RicanPuget Sound SalishRomanianRussianSalvadoranSamoanScandinavianScotch-IrishScottishSeminoleSenegaleseSerbianShoshoneSierra LeoneanSiouxSlavicSlovakSloveneSomaliSouth AmericanSouth American IndianSoviet UnionSpaniardSpanishSpanish AmericanSpanish American IndianSri LankanSubsaharan AfricanSudaneseSwedishSwissSyrianTaiwaneseThaiTlingit-HaidaTohono O'OdhamTonganTrinidadian and TobagonianTsimshianTurkishU.S. Virgin IslanderUgandanUkrainianUruguayanUteVenezuelanVietnameseWelshWest IndianYakamaYaquiYugoslavianYumanYup'ikZimbabwean
Immigration
NonimmigrantsImmigrantsAfghanistanAfricaAlbaniaArgentinaArmeniaAsiaAustraliaAustriaBahamasBangladeshBarbadosBelarusBelgiumBelizeBoliviaBosnia and HerzegovinaBrazilBulgariaBurma/MyanmarCabo VerdeCambodiaCameroonCanadaCaribbeanCentral AmericaChileChinaColombiaCongoCosta RicaCroatiaCubaCzechoslovakiaDenmarkDominicaDominican RepublicEastern AfricaEastern AsiaEastern EuropeEcuadorEgyptEl SalvadorEnglandEritreaEthiopiaEuropeFijiFranceGermanyGhanaGreeceGrenadaGuatemalaGuyanaHaitiHondurasHong KongHungaryIndiaIndonesiaIranIraqIrelandIsraelItalyJamaicaJapanJordanKazakhstanKenyaKoreaKuwaitLaosLatin AmericaLatviaLebanonLiberiaLithuaniaMalaysiaMexicoMicronesiaMiddle AfricaMoldovaMoroccoNepalNetherlandsNicaraguaNigeriaNorth AmericaNorth MacedoniaNorthern AfricaNorthern EuropeNorwayOceaniaPakistanPanamaPeruPhilippinesPolandPortugalRomaniaRussiaSaudi ArabiaScotlandSenegalSerbiaSierra LeoneSingaporeSomaliaSouth AfricaSouth AmericaSouth Central AsiaSouth Eastern AsiaSouthern EuropeSpainSri LankaSt. Vincent and the GrenadinesSudanSwedenSwitzerlandSyriaTaiwanThailandTrinidad and TobagoTurkeyUgandaUkraineUruguayUzbekistanVenezuelaVietnamWest IndiesWestern AfricaWestern AsiaWestern EuropeYemenZaireZimbabweAzores
10th Grade
Income
Poverty
Unemployment
Labor Participation
Family Structure
Vehicle Availability
Education Level
Disability

10th Grade Comparison

South Africans

Guamanians/Chamorros

Exceptional
Fair
94.7%
10TH GRADE
98.8/ 100
METRIC RATING
90th/ 347
METRIC RANK
93.6%
10TH GRADE
37.1/ 100
METRIC RATING
183rd/ 347
METRIC RANK

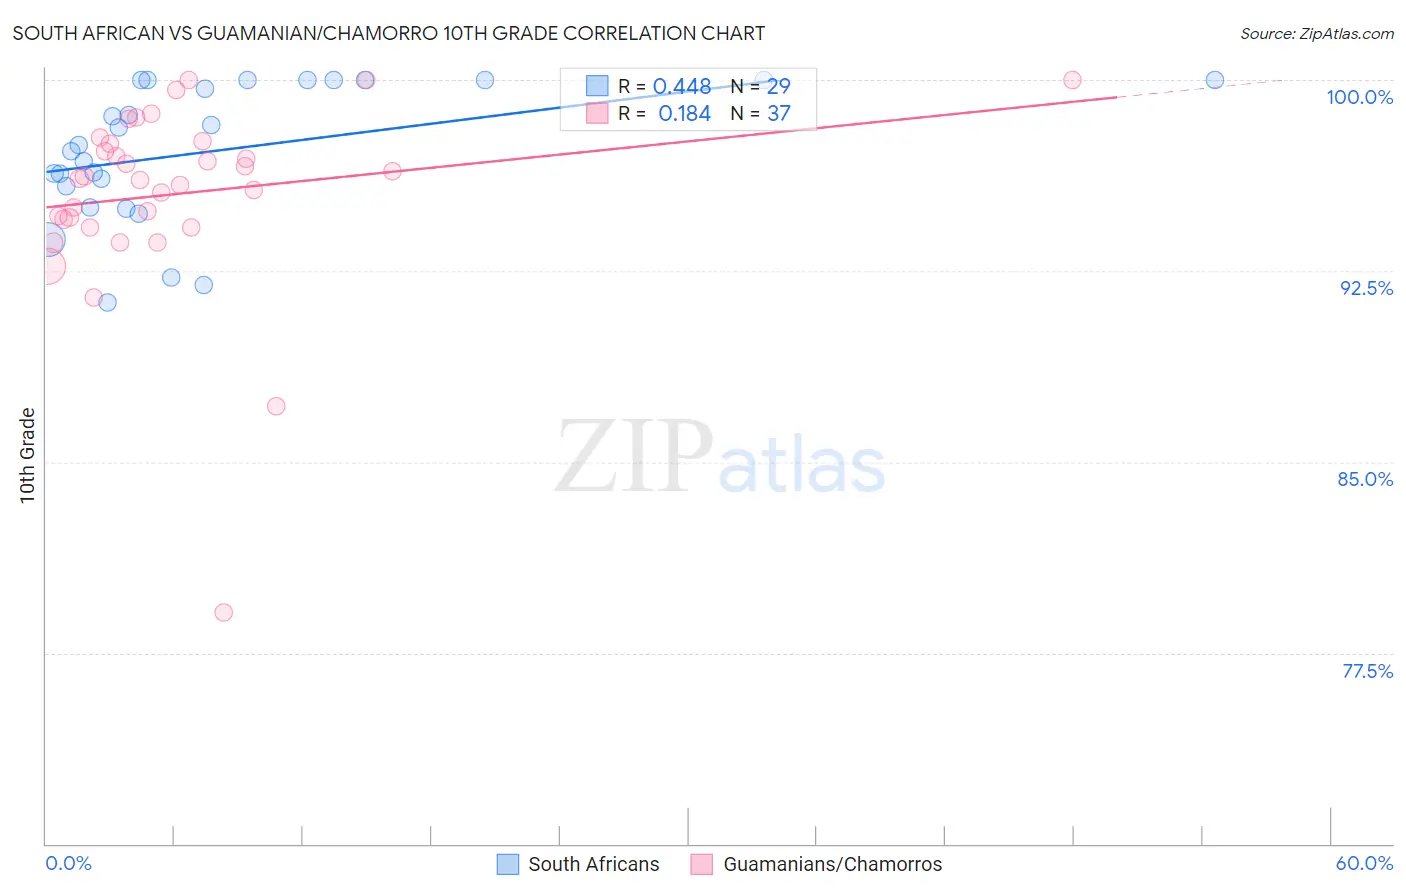
South African vs Guamanian/Chamorro 10th Grade Correlation Chart

The statistical analysis conducted on geographies consisting of 182,604,532 people shows a moderate positive correlation between the proportion of South Africans and percentage of population with at least 10th grade education in the United States with a correlation coefficient (R) of 0.448 and weighted average of 94.7%. Similarly, the statistical analysis conducted on geographies consisting of 221,965,618 people shows a poor positive correlation between the proportion of Guamanians/Chamorros and percentage of population with at least 10th grade education in the United States with a correlation coefficient (R) of 0.184 and weighted average of 93.6%, a difference of 1.1%.
South African vs Guamanian/Chamorro 10th Grade

10th Grade Correlation Summary

MeasurementSouth AfricanGuamanian/Chamorro
Minimum91.3%79.1%
Maximum100.0%100.0%
Range8.7%20.9%
Mean97.2%95.5%
Median97.5%96.1%
Interquartile 25% (IQ1)95.4%94.4%
Interquartile 75% (IQ3)100.0%97.5%
Interquartile Range (IQR)4.6%3.2%
Standard Deviation (Sample)2.7%3.8%
Standard Deviation (Population)2.6%3.7%

Similar Demographics by 10th Grade

Demographics Similar to South Africans by 10th Grade

In terms of 10th grade, the demographic groups most similar to South Africans are Immigrants from Moldova (94.7%, a difference of 0.010%), White/Caucasian (94.7%, a difference of 0.010%), Immigrants from Japan (94.7%, a difference of 0.020%), Immigrants from Saudi Arabia (94.7%, a difference of 0.030%), and Crow (94.7%, a difference of 0.040%).
DemographicsRating | Rank10th Grade
Immigrants | Western Europe
99.1
/100
|
#83
Exceptional
94.7%
Icelanders
99.1
/100
|
#84
Exceptional
94.7%
Crow
99.0
/100
|
#85
Exceptional
94.7%
Puget Sound Salish
99.0
/100
|
#86
Exceptional
94.7%
Immigrants | Saudi Arabia
99.0
/100
|
#87
Exceptional
94.7%
Immigrants | Japan
99.0
/100
|
#88
Exceptional
94.7%
Immigrants | Moldova
98.9
/100
|
#89
Exceptional
94.7%
South Africans
98.8
/100
|
#90
Exceptional
94.7%
Whites/Caucasians
98.8
/100
|
#91
Exceptional
94.7%
Yugoslavians
98.4
/100
|
#92
Exceptional
94.6%
Soviet Union
98.3
/100
|
#93
Exceptional
94.6%
Immigrants | Germany
98.3
/100
|
#94
Exceptional
94.6%
Menominee
98.3
/100
|
#95
Exceptional
94.6%
Immigrants | Switzerland
98.3
/100
|
#96
Exceptional
94.6%
Lebanese
98.3
/100
|
#97
Exceptional
94.6%

Demographics Similar to Guamanians/Chamorros by 10th Grade

In terms of 10th grade, the demographic groups most similar to Guamanians/Chamorros are Choctaw (93.6%, a difference of 0.0%), Sudanese (93.6%, a difference of 0.0%), Colville (93.6%, a difference of 0.020%), Immigrants from Eastern Asia (93.6%, a difference of 0.020%), and Liberian (93.6%, a difference of 0.020%).
DemographicsRating | Rank10th Grade
Immigrants | Argentina
47.1
/100
|
#176
Average
93.7%
Immigrants | Lebanon
47.1
/100
|
#177
Average
93.7%
Sierra Leoneans
46.1
/100
|
#178
Average
93.7%
Paraguayans
45.3
/100
|
#179
Average
93.7%
Blackfeet
42.8
/100
|
#180
Average
93.7%
Immigrants | Northern Africa
41.6
/100
|
#181
Average
93.7%
Colville
38.8
/100
|
#182
Fair
93.6%
Guamanians/Chamorros
37.1
/100
|
#183
Fair
93.6%
Choctaw
36.6
/100
|
#184
Fair
93.6%
Sudanese
36.6
/100
|
#185
Fair
93.6%
Immigrants | Eastern Asia
35.1
/100
|
#186
Fair
93.6%
Liberians
34.7
/100
|
#187
Fair
93.6%
Marshallese
33.2
/100
|
#188
Fair
93.6%
Immigrants | Pakistan
32.5
/100
|
#189
Fair
93.6%
Laotians
32.1
/100
|
#190
Fair
93.6%