Somali vs Immigrants from Serbia 4th Grade

COMPARE

Somali
Race
Ancestry
AfghanAfricanAlaska NativeAlaskan AthabascanAlbanianAleutAlsatianAmericanApacheArabArapahoArgentineanArmenianAssyrian/Chaldean/SyriacAustralianAustrianBahamianBangladeshiBarbadianBasqueBelgianBelizeanBermudanBhutaneseBlackfeetBolivianBrazilianBritishBritish West IndianBulgarianBurmeseCajunCambodianCanadianCape VerdeanCarpatho RusynCelticCentral AmericanCentral American IndianCherokeeCheyenneChickasawChileanChineseChippewaChoctawColombianColvilleComancheCosta RicanCreeCreekCroatianCrowCubanCypriotCzechCzechoslovakianDanishDelawareDominicanDutchDutch West IndianEastern EuropeanEcuadorianEgyptianEnglishEstonianEthiopianEuropeanFijianFilipinoFinnishFrenchFrench American IndianFrench CanadianGermanGerman RussianGhanaianGreekGuamanian/ChamorroGuatemalanGuyaneseHaitianHmongHonduranHopiHoumaHungarianIcelanderIndian (Asian)IndonesianInupiatIranianIraqiIrishIroquoisIsraeliItalianJamaicanJapaneseJordanianKenyanKiowaKoreanLaotianLatvianLebaneseLiberianLithuanianLumbeeLuxembourgerMacedonianMalaysianMalteseMarshalleseMenomineeMexicanMexican American IndianMongolianMoroccanNative HawaiianNavajoNepaleseNew ZealanderNicaraguanNigerianNorthern EuropeanNorwegianOkinawanOsageOttawaPaiutePakistaniPalestinianPanamanianParaguayanPennsylvania GermanPeruvianPimaPolishPortuguesePotawatomiPuebloPuerto RicanPuget Sound SalishRomanianRussianSalvadoranSamoanScandinavianScotch-IrishScottishSeminoleSenegaleseSerbianShoshoneSierra LeoneanSiouxSlavicSlovakSloveneSomaliSouth AfricanSouth AmericanSouth American IndianSoviet UnionSpaniardSpanishSpanish AmericanSpanish American IndianSri LankanSubsaharan AfricanSudaneseSwedishSwissSyrianTaiwaneseThaiTlingit-HaidaTohono O'OdhamTonganTrinidadian and TobagonianTsimshianTurkishU.S. Virgin IslanderUgandanUkrainianUruguayanUteVenezuelanVietnameseWelshWest IndianYakamaYaquiYugoslavianYumanYup'ikZimbabwean
Immigration
NonimmigrantsImmigrantsAfghanistanAfricaAlbaniaArgentinaArmeniaAsiaAustraliaAustriaBahamasBangladeshBarbadosBelarusBelgiumBelizeBoliviaBosnia and HerzegovinaBrazilBulgariaBurma/MyanmarCabo VerdeCambodiaCameroonCanadaCaribbeanCentral AmericaChileChinaColombiaCongoCosta RicaCroatiaCubaCzechoslovakiaDenmarkDominicaDominican RepublicEastern AfricaEastern AsiaEastern EuropeEcuadorEgyptEl SalvadorEnglandEritreaEthiopiaEuropeFijiFranceGermanyGhanaGreeceGrenadaGuatemalaGuyanaHaitiHondurasHong KongHungaryIndiaIndonesiaIranIraqIrelandIsraelItalyJamaicaJapanJordanKazakhstanKenyaKoreaKuwaitLaosLatin AmericaLatviaLebanonLiberiaLithuaniaMalaysiaMexicoMicronesiaMiddle AfricaMoldovaMoroccoNepalNetherlandsNicaraguaNigeriaNorth AmericaNorth MacedoniaNorthern AfricaNorthern EuropeNorwayOceaniaPakistanPanamaPeruPhilippinesPolandPortugalRomaniaRussiaSaudi ArabiaScotlandSenegalSierra LeoneSingaporeSomaliaSouth AfricaSouth AmericaSouth Central AsiaSouth Eastern AsiaSouthern EuropeSpainSri LankaSt. Vincent and the GrenadinesSudanSwedenSwitzerlandSyriaTaiwanThailandTrinidad and TobagoTurkeyUgandaUkraineUruguayUzbekistanVenezuelaVietnamWest IndiesWestern AfricaWestern AsiaWestern EuropeYemenZaireZimbabweAzores
Immigrants from Serbia
Race
Ancestry
AfghanAfricanAlaska NativeAlaskan AthabascanAlbanianAleutAlsatianAmericanApacheArabArapahoArgentineanArmenianAssyrian/Chaldean/SyriacAustralianAustrianBahamianBangladeshiBarbadianBasqueBelgianBelizeanBermudanBhutaneseBlackfeetBolivianBrazilianBritishBritish West IndianBulgarianBurmeseCajunCambodianCanadianCape VerdeanCarpatho RusynCelticCentral AmericanCentral American IndianCherokeeCheyenneChickasawChileanChineseChippewaChoctawColombianColvilleComancheCosta RicanCreeCreekCroatianCrowCubanCypriotCzechCzechoslovakianDanishDelawareDominicanDutchDutch West IndianEastern EuropeanEcuadorianEgyptianEnglishEstonianEthiopianEuropeanFijianFilipinoFinnishFrenchFrench American IndianFrench CanadianGermanGerman RussianGhanaianGreekGuamanian/ChamorroGuatemalanGuyaneseHaitianHmongHonduranHopiHoumaHungarianIcelanderIndian (Asian)IndonesianInupiatIranianIraqiIrishIroquoisIsraeliItalianJamaicanJapaneseJordanianKenyanKiowaKoreanLaotianLatvianLebaneseLiberianLithuanianLumbeeLuxembourgerMacedonianMalaysianMalteseMarshalleseMenomineeMexicanMexican American IndianMongolianMoroccanNative HawaiianNavajoNepaleseNew ZealanderNicaraguanNigerianNorthern EuropeanNorwegianOkinawanOsageOttawaPaiutePakistaniPalestinianPanamanianParaguayanPennsylvania GermanPeruvianPimaPolishPortuguesePotawatomiPuebloPuerto RicanPuget Sound SalishRomanianRussianSalvadoranSamoanScandinavianScotch-IrishScottishSeminoleSenegaleseSerbianShoshoneSierra LeoneanSiouxSlavicSlovakSloveneSouth AfricanSouth AmericanSouth American IndianSoviet UnionSpaniardSpanishSpanish AmericanSpanish American IndianSri LankanSubsaharan AfricanSudaneseSwedishSwissSyrianTaiwaneseThaiTlingit-HaidaTohono O'OdhamTonganTrinidadian and TobagonianTsimshianTurkishU.S. Virgin IslanderUgandanUkrainianUruguayanUteVenezuelanVietnameseWelshWest IndianYakamaYaquiYugoslavianYumanYup'ikZimbabwean
Immigration
NonimmigrantsImmigrantsAfghanistanAfricaAlbaniaArgentinaArmeniaAsiaAustraliaAustriaBahamasBangladeshBarbadosBelarusBelgiumBelizeBoliviaBosnia and HerzegovinaBrazilBulgariaBurma/MyanmarCabo VerdeCambodiaCameroonCanadaCaribbeanCentral AmericaChileChinaColombiaCongoCosta RicaCroatiaCubaCzechoslovakiaDenmarkDominicaDominican RepublicEastern AfricaEastern AsiaEastern EuropeEcuadorEgyptEl SalvadorEnglandEritreaEthiopiaEuropeFijiFranceGermanyGhanaGreeceGrenadaGuatemalaGuyanaHaitiHondurasHong KongHungaryIndiaIndonesiaIranIraqIrelandIsraelItalyJamaicaJapanJordanKazakhstanKenyaKoreaKuwaitLaosLatin AmericaLatviaLebanonLiberiaLithuaniaMalaysiaMexicoMicronesiaMiddle AfricaMoldovaMoroccoNepalNetherlandsNicaraguaNigeriaNorth AmericaNorth MacedoniaNorthern AfricaNorthern EuropeNorwayOceaniaPakistanPanamaPeruPhilippinesPolandPortugalRomaniaRussiaSaudi ArabiaScotlandSenegalSerbiaSierra LeoneSingaporeSomaliaSouth AfricaSouth AmericaSouth Central AsiaSouth Eastern AsiaSouthern EuropeSpainSri LankaSt. Vincent and the GrenadinesSudanSwedenSwitzerlandSyriaTaiwanThailandTrinidad and TobagoTurkeyUgandaUkraineUruguayUzbekistanVenezuelaVietnamWest IndiesWestern AfricaWestern AsiaWestern EuropeYemenZaireZimbabweAzores
4th Grade
Income
Poverty
Unemployment
Labor Participation
Family Structure
Vehicle Availability
Education Level
Disability

4th Grade Comparison

Somalis

Immigrants from Serbia

Tragic
Exceptional
96.6%
4TH GRADE
0.0/ 100
METRIC RATING
296th/ 347
METRIC RANK
97.8%
4TH GRADE
92.6/ 100
METRIC RATING
125th/ 347
METRIC RANK

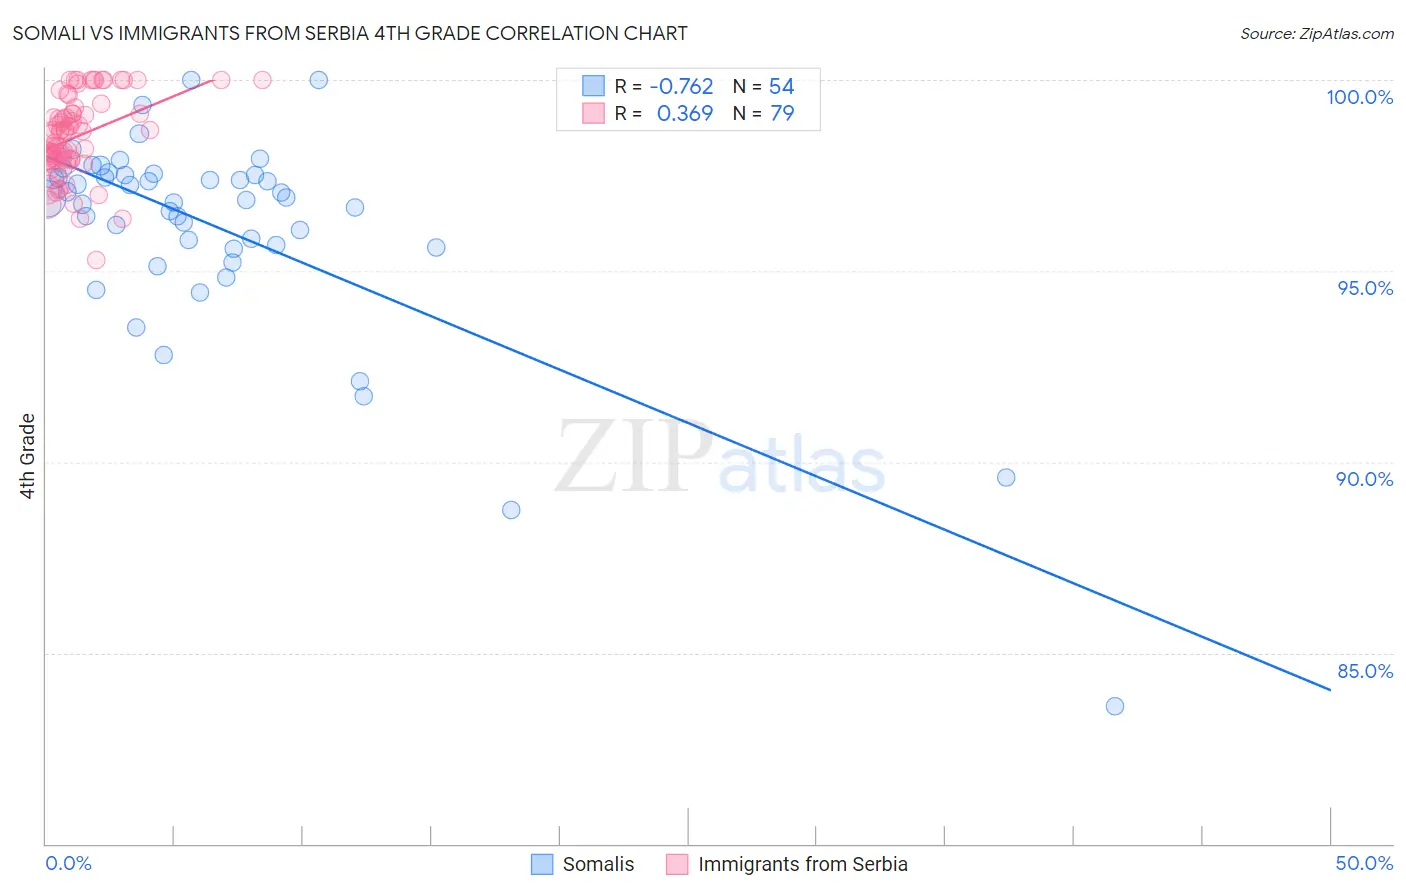
Somali vs Immigrants from Serbia 4th Grade Correlation Chart

The statistical analysis conducted on geographies consisting of 99,332,457 people shows a strong negative correlation between the proportion of Somalis and percentage of population with at least 4th grade education in the United States with a correlation coefficient (R) of -0.762 and weighted average of 96.6%. Similarly, the statistical analysis conducted on geographies consisting of 131,729,423 people shows a mild positive correlation between the proportion of Immigrants from Serbia and percentage of population with at least 4th grade education in the United States with a correlation coefficient (R) of 0.369 and weighted average of 97.8%, a difference of 1.2%.
Somali vs Immigrants from Serbia 4th Grade

4th Grade Correlation Summary

MeasurementSomaliImmigrants from Serbia
Minimum83.6%95.3%
Maximum100.0%100.0%
Range16.4%4.7%
Mean96.1%98.5%
Median96.9%98.7%
Interquartile 25% (IQ1)95.6%97.9%
Interquartile 75% (IQ3)97.5%99.1%
Interquartile Range (IQR)1.9%1.2%
Standard Deviation (Sample)2.8%1.0%
Standard Deviation (Population)2.8%1.0%

Similar Demographics by 4th Grade

Demographics Similar to Somalis by 4th Grade

In terms of 4th grade, the demographic groups most similar to Somalis are Immigrants from Portugal (96.6%, a difference of 0.010%), Immigrants from Eritrea (96.7%, a difference of 0.030%), Puerto Rican (96.7%, a difference of 0.050%), Malaysian (96.7%, a difference of 0.070%), and Immigrants from Grenada (96.7%, a difference of 0.080%).
DemographicsRating | Rank4th Grade
Immigrants | West Indies
0.0
/100
|
#289
Tragic
96.7%
British West Indians
0.0
/100
|
#290
Tragic
96.7%
Immigrants | Grenada
0.0
/100
|
#291
Tragic
96.7%
Malaysians
0.0
/100
|
#292
Tragic
96.7%
Puerto Ricans
0.0
/100
|
#293
Tragic
96.7%
Immigrants | Eritrea
0.0
/100
|
#294
Tragic
96.7%
Immigrants | Portugal
0.0
/100
|
#295
Tragic
96.6%
Somalis
0.0
/100
|
#296
Tragic
96.6%
Immigrants | Somalia
0.0
/100
|
#297
Tragic
96.5%
Haitians
0.0
/100
|
#298
Tragic
96.5%
Immigrants | Dominica
0.0
/100
|
#299
Tragic
96.5%
Immigrants | South Eastern Asia
0.0
/100
|
#300
Tragic
96.5%
Immigrants | Immigrants
0.0
/100
|
#301
Tragic
96.5%
Immigrants | Cuba
0.0
/100
|
#302
Tragic
96.4%
Guyanese
0.0
/100
|
#303
Tragic
96.4%

Demographics Similar to Immigrants from Serbia by 4th Grade

In terms of 4th grade, the demographic groups most similar to Immigrants from Serbia are Immigrants from Europe (97.8%, a difference of 0.0%), Colville (97.7%, a difference of 0.0%), Pima (97.7%, a difference of 0.010%), Immigrants from Norway (97.8%, a difference of 0.020%), and Immigrants from Japan (97.8%, a difference of 0.020%).
DemographicsRating | Rank4th Grade
Menominee
94.9
/100
|
#118
Exceptional
97.8%
Immigrants | Saudi Arabia
94.8
/100
|
#119
Exceptional
97.8%
Immigrants | France
94.8
/100
|
#120
Exceptional
97.8%
Immigrants | Norway
94.2
/100
|
#121
Exceptional
97.8%
Immigrants | Japan
94.1
/100
|
#122
Exceptional
97.8%
Immigrants | Zimbabwe
93.9
/100
|
#123
Exceptional
97.8%
Spanish
93.7
/100
|
#124
Exceptional
97.8%
Immigrants | Serbia
92.6
/100
|
#125
Exceptional
97.8%
Immigrants | Europe
92.5
/100
|
#126
Exceptional
97.8%
Colville
92.3
/100
|
#127
Exceptional
97.7%
Pima
92.0
/100
|
#128
Exceptional
97.7%
Immigrants | Bulgaria
91.3
/100
|
#129
Exceptional
97.7%
Immigrants | Romania
90.6
/100
|
#130
Exceptional
97.7%
Immigrants | Kuwait
89.7
/100
|
#131
Excellent
97.7%
Immigrants | Hungary
89.3
/100
|
#132
Excellent
97.7%