Somali vs Armenian Doctorate Degree

COMPARE

Somali
Race
Ancestry
AfghanAfricanAlaska NativeAlaskan AthabascanAlbanianAleutAlsatianAmericanApacheArabArapahoArgentineanAssyrian/Chaldean/SyriacAustralianAustrianBahamianBangladeshiBarbadianBasqueBelgianBelizeanBermudanBhutaneseBlackfeetBolivianBrazilianBritishBritish West IndianBulgarianBurmeseCajunCambodianCanadianCape VerdeanCarpatho RusynCelticCentral AmericanCentral American IndianCherokeeCheyenneChickasawChileanChineseChippewaChoctawColombianColvilleComancheCosta RicanCreeCreekCroatianCrowCubanCypriotCzechCzechoslovakianDanishDelawareDominicanDutchDutch West IndianEastern EuropeanEcuadorianEgyptianEnglishEstonianEthiopianEuropeanFijianFilipinoFinnishFrenchFrench American IndianFrench CanadianGermanGerman RussianGhanaianGreekGuamanian/ChamorroGuatemalanGuyaneseHaitianHmongHonduranHopiHoumaHungarianIcelanderIndian (Asian)IndonesianInupiatIranianIraqiIrishIroquoisIsraeliItalianJamaicanJapaneseJordanianKenyanKiowaKoreanLaotianLatvianLebaneseLiberianLithuanianLumbeeLuxembourgerMacedonianMalaysianMalteseMarshalleseMenomineeMexicanMexican American IndianMongolianMoroccanNative HawaiianNavajoNepaleseNew ZealanderNicaraguanNigerianNorthern EuropeanNorwegianOkinawanOsageOttawaPaiutePakistaniPalestinianPanamanianParaguayanPennsylvania GermanPeruvianPimaPolishPortuguesePotawatomiPuebloPuerto RicanPuget Sound SalishRomanianRussianSalvadoranSamoanScandinavianScotch-IrishScottishSeminoleSenegaleseSerbianShoshoneSierra LeoneanSiouxSlavicSlovakSloveneSomaliSouth AfricanSouth AmericanSouth American IndianSoviet UnionSpaniardSpanishSpanish AmericanSpanish American IndianSri LankanSubsaharan AfricanSudaneseSwedishSwissSyrianTaiwaneseThaiTlingit-HaidaTohono O'OdhamTonganTrinidadian and TobagonianTsimshianTurkishU.S. Virgin IslanderUgandanUkrainianUruguayanUteVenezuelanVietnameseWelshWest IndianYakamaYaquiYugoslavianYumanYup'ikZimbabwean
Immigration
NonimmigrantsImmigrantsAfghanistanAfricaAlbaniaArgentinaArmeniaAsiaAustraliaAustriaBahamasBangladeshBarbadosBelarusBelgiumBelizeBoliviaBosnia and HerzegovinaBrazilBulgariaBurma/MyanmarCabo VerdeCambodiaCameroonCanadaCaribbeanCentral AmericaChileChinaColombiaCongoCosta RicaCroatiaCubaCzechoslovakiaDenmarkDominicaDominican RepublicEastern AfricaEastern AsiaEastern EuropeEcuadorEgyptEl SalvadorEnglandEritreaEthiopiaEuropeFijiFranceGermanyGhanaGreeceGrenadaGuatemalaGuyanaHaitiHondurasHong KongHungaryIndiaIndonesiaIranIraqIrelandIsraelItalyJamaicaJapanJordanKazakhstanKenyaKoreaKuwaitLaosLatin AmericaLatviaLebanonLiberiaLithuaniaMalaysiaMexicoMicronesiaMiddle AfricaMoldovaMoroccoNepalNetherlandsNicaraguaNigeriaNorth AmericaNorth MacedoniaNorthern AfricaNorthern EuropeNorwayOceaniaPakistanPanamaPeruPhilippinesPolandPortugalRomaniaRussiaSaudi ArabiaScotlandSenegalSerbiaSierra LeoneSingaporeSomaliaSouth AfricaSouth AmericaSouth Central AsiaSouth Eastern AsiaSouthern EuropeSpainSri LankaSt. Vincent and the GrenadinesSudanSwedenSwitzerlandSyriaTaiwanThailandTrinidad and TobagoTurkeyUgandaUkraineUruguayUzbekistanVenezuelaVietnamWest IndiesWestern AfricaWestern AsiaWestern EuropeYemenZaireZimbabweAzores
Armenian
Race
Ancestry
AfghanAfricanAlaska NativeAlaskan AthabascanAlbanianAleutAlsatianAmericanApacheArabArapahoArgentineanArmenianAssyrian/Chaldean/SyriacAustralianAustrianBahamianBangladeshiBarbadianBasqueBelgianBelizeanBermudanBhutaneseBlackfeetBolivianBrazilianBritishBritish West IndianBulgarianBurmeseCajunCambodianCanadianCape VerdeanCarpatho RusynCelticCentral AmericanCentral American IndianCherokeeCheyenneChickasawChileanChineseChippewaChoctawColombianColvilleComancheCosta RicanCreeCreekCroatianCrowCubanCypriotCzechCzechoslovakianDanishDelawareDominicanDutchDutch West IndianEastern EuropeanEcuadorianEgyptianEnglishEstonianEthiopianEuropeanFijianFilipinoFinnishFrenchFrench American IndianFrench CanadianGermanGerman RussianGhanaianGreekGuamanian/ChamorroGuatemalanGuyaneseHaitianHmongHonduranHopiHoumaHungarianIcelanderIndian (Asian)IndonesianInupiatIranianIraqiIrishIroquoisIsraeliItalianJamaicanJapaneseJordanianKenyanKiowaKoreanLaotianLatvianLebaneseLiberianLithuanianLumbeeLuxembourgerMacedonianMalaysianMalteseMarshalleseMenomineeMexicanMexican American IndianMongolianMoroccanNative HawaiianNavajoNepaleseNew ZealanderNicaraguanNigerianNorthern EuropeanNorwegianOkinawanOsageOttawaPaiutePakistaniPalestinianPanamanianParaguayanPennsylvania GermanPeruvianPimaPolishPortuguesePotawatomiPuebloPuerto RicanPuget Sound SalishRomanianRussianSalvadoranSamoanScandinavianScotch-IrishScottishSeminoleSenegaleseSerbianShoshoneSierra LeoneanSiouxSlavicSlovakSloveneSouth AfricanSouth AmericanSouth American IndianSoviet UnionSpaniardSpanishSpanish AmericanSpanish American IndianSri LankanSubsaharan AfricanSudaneseSwedishSwissSyrianTaiwaneseThaiTlingit-HaidaTohono O'OdhamTonganTrinidadian and TobagonianTsimshianTurkishU.S. Virgin IslanderUgandanUkrainianUruguayanUteVenezuelanVietnameseWelshWest IndianYakamaYaquiYugoslavianYumanYup'ikZimbabwean
Immigration
NonimmigrantsImmigrantsAfghanistanAfricaAlbaniaArgentinaArmeniaAsiaAustraliaAustriaBahamasBangladeshBarbadosBelarusBelgiumBelizeBoliviaBosnia and HerzegovinaBrazilBulgariaBurma/MyanmarCabo VerdeCambodiaCameroonCanadaCaribbeanCentral AmericaChileChinaColombiaCongoCosta RicaCroatiaCubaCzechoslovakiaDenmarkDominicaDominican RepublicEastern AfricaEastern AsiaEastern EuropeEcuadorEgyptEl SalvadorEnglandEritreaEthiopiaEuropeFijiFranceGermanyGhanaGreeceGrenadaGuatemalaGuyanaHaitiHondurasHong KongHungaryIndiaIndonesiaIranIraqIrelandIsraelItalyJamaicaJapanJordanKazakhstanKenyaKoreaKuwaitLaosLatin AmericaLatviaLebanonLiberiaLithuaniaMalaysiaMexicoMicronesiaMiddle AfricaMoldovaMoroccoNepalNetherlandsNicaraguaNigeriaNorth AmericaNorth MacedoniaNorthern AfricaNorthern EuropeNorwayOceaniaPakistanPanamaPeruPhilippinesPolandPortugalRomaniaRussiaSaudi ArabiaScotlandSenegalSerbiaSierra LeoneSingaporeSomaliaSouth AfricaSouth AmericaSouth Central AsiaSouth Eastern AsiaSouthern EuropeSpainSri LankaSt. Vincent and the GrenadinesSudanSwedenSwitzerlandSyriaTaiwanThailandTrinidad and TobagoTurkeyUgandaUkraineUruguayUzbekistanVenezuelaVietnamWest IndiesWestern AfricaWestern AsiaWestern EuropeYemenZaireZimbabweAzores
Doctorate Degree
Income
Poverty
Unemployment
Labor Participation
Family Structure
Vehicle Availability
Education Level
Disability

Doctorate Degree Comparison

Somalis

Armenians

Fair
Exceptional
1.7%
DOCTORATE DEGREE
21.2/ 100
METRIC RATING
204th/ 347
METRIC RANK
2.1%
DOCTORATE DEGREE
98.3/ 100
METRIC RATING
98th/ 347
METRIC RANK

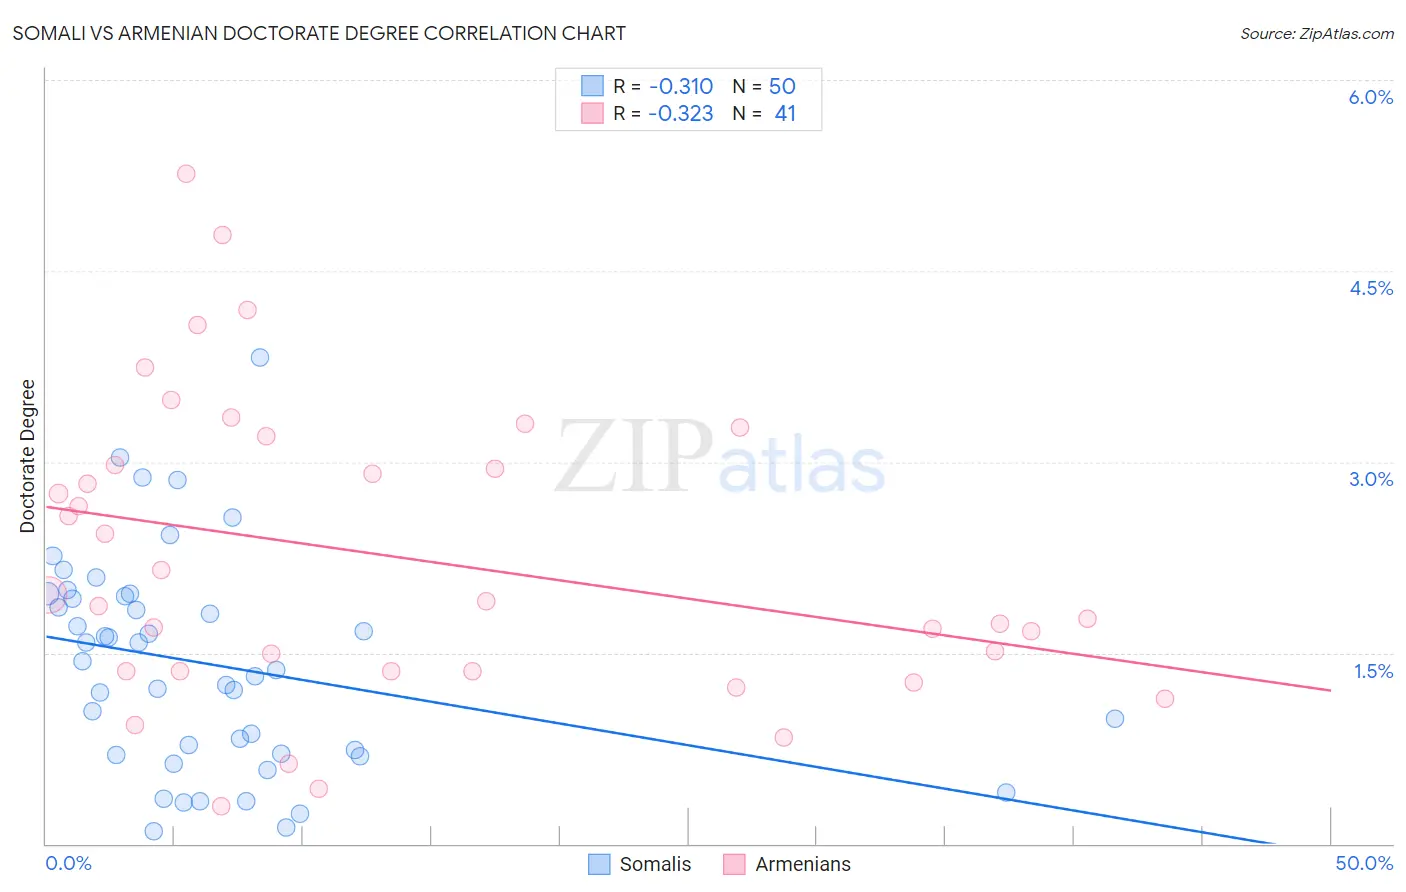
Somali vs Armenian Doctorate Degree Correlation Chart

The statistical analysis conducted on geographies consisting of 99,087,953 people shows a mild negative correlation between the proportion of Somalis and percentage of population with at least doctorate degree education in the United States with a correlation coefficient (R) of -0.310 and weighted average of 1.7%. Similarly, the statistical analysis conducted on geographies consisting of 309,311,130 people shows a mild negative correlation between the proportion of Armenians and percentage of population with at least doctorate degree education in the United States with a correlation coefficient (R) of -0.323 and weighted average of 2.1%, a difference of 20.7%.
Somali vs Armenian Doctorate Degree

Doctorate Degree Correlation Summary

MeasurementSomaliArmenian
Minimum0.094%0.29%
Maximum3.8%5.3%
Range3.7%5.0%
Mean1.4%2.3%
Median1.4%1.9%
Interquartile 25% (IQ1)0.70%1.4%
Interquartile 75% (IQ3)1.9%3.1%
Interquartile Range (IQR)1.2%1.7%
Standard Deviation (Sample)0.84%1.2%
Standard Deviation (Population)0.83%1.2%

Similar Demographics by Doctorate Degree

Demographics Similar to Somalis by Doctorate Degree

In terms of doctorate degree, the demographic groups most similar to Somalis are Immigrants from Vietnam (1.8%, a difference of 0.030%), Portuguese (1.8%, a difference of 0.050%), Immigrants from Nigeria (1.8%, a difference of 0.28%), White/Caucasian (1.8%, a difference of 0.35%), and Venezuelan (1.7%, a difference of 0.41%).
DemographicsRating | RankDoctorate Degree
Chinese
25.1
/100
|
#197
Fair
1.8%
Immigrants | Ghana
24.6
/100
|
#198
Fair
1.8%
Immigrants | South America
23.3
/100
|
#199
Fair
1.8%
Whites/Caucasians
22.8
/100
|
#200
Fair
1.8%
Immigrants | Nigeria
22.4
/100
|
#201
Fair
1.8%
Portuguese
21.4
/100
|
#202
Fair
1.8%
Immigrants | Vietnam
21.4
/100
|
#203
Fair
1.8%
Somalis
21.2
/100
|
#204
Fair
1.7%
Venezuelans
19.5
/100
|
#205
Poor
1.7%
Immigrants | Peru
17.6
/100
|
#206
Poor
1.7%
Yugoslavians
17.1
/100
|
#207
Poor
1.7%
Colombians
16.1
/100
|
#208
Poor
1.7%
Immigrants | Western Africa
15.4
/100
|
#209
Poor
1.7%
Tongans
15.1
/100
|
#210
Poor
1.7%
Immigrants | Armenia
15.1
/100
|
#211
Poor
1.7%

Demographics Similar to Armenians by Doctorate Degree

In terms of doctorate degree, the demographic groups most similar to Armenians are Immigrants from Eritrea (2.1%, a difference of 0.080%), Immigrants from Egypt (2.1%, a difference of 0.18%), Immigrants from Eastern Europe (2.1%, a difference of 0.18%), Immigrants from Northern Africa (2.1%, a difference of 0.21%), and Immigrants from Eastern Africa (2.1%, a difference of 0.21%).
DemographicsRating | RankDoctorate Degree
Immigrants | Sudan
99.1
/100
|
#91
Exceptional
2.2%
Chileans
99.1
/100
|
#92
Exceptional
2.2%
Alsatians
99.0
/100
|
#93
Exceptional
2.1%
Greeks
98.8
/100
|
#94
Exceptional
2.1%
Immigrants | Romania
98.7
/100
|
#95
Exceptional
2.1%
Immigrants | Northern Africa
98.4
/100
|
#96
Exceptional
2.1%
Immigrants | Eritrea
98.4
/100
|
#97
Exceptional
2.1%
Armenians
98.3
/100
|
#98
Exceptional
2.1%
Immigrants | Egypt
98.2
/100
|
#99
Exceptional
2.1%
Immigrants | Eastern Europe
98.2
/100
|
#100
Exceptional
2.1%
Immigrants | Eastern Africa
98.2
/100
|
#101
Exceptional
2.1%
Immigrants | Chile
98.1
/100
|
#102
Exceptional
2.1%
Romanians
98.1
/100
|
#103
Exceptional
2.1%
Austrians
98.0
/100
|
#104
Exceptional
2.1%
Arabs
97.8
/100
|
#105
Exceptional
2.1%