Slovene vs Tohono O'odham Master's Degree

COMPARE

Slovene
Race
Ancestry
AfghanAfricanAlaska NativeAlaskan AthabascanAlbanianAleutAlsatianAmericanApacheArabArapahoArgentineanArmenianAssyrian/Chaldean/SyriacAustralianAustrianBahamianBangladeshiBarbadianBasqueBelgianBelizeanBermudanBhutaneseBlackfeetBolivianBrazilianBritishBritish West IndianBulgarianBurmeseCajunCambodianCanadianCape VerdeanCarpatho RusynCelticCentral AmericanCentral American IndianCherokeeCheyenneChickasawChileanChineseChippewaChoctawColombianColvilleComancheCosta RicanCreeCreekCroatianCrowCubanCypriotCzechCzechoslovakianDanishDelawareDominicanDutchDutch West IndianEastern EuropeanEcuadorianEgyptianEnglishEstonianEthiopianEuropeanFijianFilipinoFinnishFrenchFrench American IndianFrench CanadianGermanGerman RussianGhanaianGreekGuamanian/ChamorroGuatemalanGuyaneseHaitianHmongHonduranHopiHoumaHungarianIcelanderIndian (Asian)IndonesianInupiatIranianIraqiIrishIroquoisIsraeliItalianJamaicanJapaneseJordanianKenyanKiowaKoreanLaotianLatvianLebaneseLiberianLithuanianLumbeeLuxembourgerMacedonianMalaysianMalteseMarshalleseMenomineeMexicanMexican American IndianMongolianMoroccanNative HawaiianNavajoNepaleseNew ZealanderNicaraguanNigerianNorthern EuropeanNorwegianOkinawanOsageOttawaPaiutePakistaniPalestinianPanamanianParaguayanPennsylvania GermanPeruvianPimaPolishPortuguesePotawatomiPuebloPuerto RicanPuget Sound SalishRomanianRussianSalvadoranSamoanScandinavianScotch-IrishScottishSeminoleSenegaleseSerbianShoshoneSierra LeoneanSiouxSlavicSlovakSloveneSomaliSouth AfricanSouth AmericanSouth American IndianSoviet UnionSpaniardSpanishSpanish AmericanSpanish American IndianSri LankanSubsaharan AfricanSudaneseSwedishSwissSyrianTaiwaneseThaiTlingit-HaidaTonganTrinidadian and TobagonianTsimshianTurkishU.S. Virgin IslanderUgandanUkrainianUruguayanUteVenezuelanVietnameseWelshWest IndianYakamaYaquiYugoslavianYumanYup'ikZimbabwean
Immigration
NonimmigrantsImmigrantsAfghanistanAfricaAlbaniaArgentinaArmeniaAsiaAustraliaAustriaBahamasBangladeshBarbadosBelarusBelgiumBelizeBoliviaBosnia and HerzegovinaBrazilBulgariaBurma/MyanmarCabo VerdeCambodiaCameroonCanadaCaribbeanCentral AmericaChileChinaColombiaCongoCosta RicaCroatiaCubaCzechoslovakiaDenmarkDominicaDominican RepublicEastern AfricaEastern AsiaEastern EuropeEcuadorEgyptEl SalvadorEnglandEritreaEthiopiaEuropeFijiFranceGermanyGhanaGreeceGrenadaGuatemalaGuyanaHaitiHondurasHong KongHungaryIndiaIndonesiaIranIraqIrelandIsraelItalyJamaicaJapanJordanKazakhstanKenyaKoreaKuwaitLaosLatin AmericaLatviaLebanonLiberiaLithuaniaMalaysiaMexicoMicronesiaMiddle AfricaMoldovaMoroccoNepalNetherlandsNicaraguaNigeriaNorth AmericaNorth MacedoniaNorthern AfricaNorthern EuropeNorwayOceaniaPakistanPanamaPeruPhilippinesPolandPortugalRomaniaRussiaSaudi ArabiaScotlandSenegalSerbiaSierra LeoneSingaporeSomaliaSouth AfricaSouth AmericaSouth Central AsiaSouth Eastern AsiaSouthern EuropeSpainSri LankaSt. Vincent and the GrenadinesSudanSwedenSwitzerlandSyriaTaiwanThailandTrinidad and TobagoTurkeyUgandaUkraineUruguayUzbekistanVenezuelaVietnamWest IndiesWestern AfricaWestern AsiaWestern EuropeYemenZaireZimbabweAzores
Tohono O'odham
Race
Ancestry
AfghanAfricanAlaska NativeAlaskan AthabascanAlbanianAleutAlsatianAmericanApacheArabArapahoArgentineanArmenianAssyrian/Chaldean/SyriacAustralianAustrianBahamianBangladeshiBarbadianBasqueBelgianBelizeanBermudanBhutaneseBlackfeetBolivianBrazilianBritishBritish West IndianBulgarianBurmeseCajunCambodianCanadianCape VerdeanCarpatho RusynCelticCentral AmericanCentral American IndianCherokeeCheyenneChickasawChileanChineseChippewaChoctawColombianColvilleComancheCosta RicanCreeCreekCroatianCrowCubanCypriotCzechCzechoslovakianDanishDelawareDominicanDutchDutch West IndianEastern EuropeanEcuadorianEgyptianEnglishEstonianEthiopianEuropeanFijianFilipinoFinnishFrenchFrench American IndianFrench CanadianGermanGerman RussianGhanaianGreekGuamanian/ChamorroGuatemalanGuyaneseHaitianHmongHonduranHopiHoumaHungarianIcelanderIndian (Asian)IndonesianInupiatIranianIraqiIrishIroquoisIsraeliItalianJamaicanJapaneseJordanianKenyanKiowaKoreanLaotianLatvianLebaneseLiberianLithuanianLumbeeLuxembourgerMacedonianMalaysianMalteseMarshalleseMenomineeMexicanMexican American IndianMongolianMoroccanNative HawaiianNavajoNepaleseNew ZealanderNicaraguanNigerianNorthern EuropeanNorwegianOkinawanOsageOttawaPaiutePakistaniPalestinianPanamanianParaguayanPennsylvania GermanPeruvianPimaPolishPortuguesePotawatomiPuebloPuerto RicanPuget Sound SalishRomanianRussianSalvadoranSamoanScandinavianScotch-IrishScottishSeminoleSenegaleseSerbianShoshoneSierra LeoneanSiouxSlavicSlovakSomaliSouth AfricanSouth AmericanSouth American IndianSoviet UnionSpaniardSpanishSpanish AmericanSpanish American IndianSri LankanSubsaharan AfricanSudaneseSwedishSwissSyrianTaiwaneseThaiTlingit-HaidaTohono O'OdhamTonganTrinidadian and TobagonianTsimshianTurkishU.S. Virgin IslanderUgandanUkrainianUruguayanUteVenezuelanVietnameseWelshWest IndianYakamaYaquiYugoslavianYumanYup'ikZimbabwean
Immigration
NonimmigrantsImmigrantsAfghanistanAfricaAlbaniaArgentinaArmeniaAsiaAustraliaAustriaBahamasBangladeshBarbadosBelarusBelgiumBelizeBoliviaBosnia and HerzegovinaBrazilBulgariaBurma/MyanmarCabo VerdeCambodiaCameroonCanadaCaribbeanCentral AmericaChileChinaColombiaCongoCosta RicaCroatiaCubaCzechoslovakiaDenmarkDominicaDominican RepublicEastern AfricaEastern AsiaEastern EuropeEcuadorEgyptEl SalvadorEnglandEritreaEthiopiaEuropeFijiFranceGermanyGhanaGreeceGrenadaGuatemalaGuyanaHaitiHondurasHong KongHungaryIndiaIndonesiaIranIraqIrelandIsraelItalyJamaicaJapanJordanKazakhstanKenyaKoreaKuwaitLaosLatin AmericaLatviaLebanonLiberiaLithuaniaMalaysiaMexicoMicronesiaMiddle AfricaMoldovaMoroccoNepalNetherlandsNicaraguaNigeriaNorth AmericaNorth MacedoniaNorthern AfricaNorthern EuropeNorwayOceaniaPakistanPanamaPeruPhilippinesPolandPortugalRomaniaRussiaSaudi ArabiaScotlandSenegalSerbiaSierra LeoneSingaporeSomaliaSouth AfricaSouth AmericaSouth Central AsiaSouth Eastern AsiaSouthern EuropeSpainSri LankaSt. Vincent and the GrenadinesSudanSwedenSwitzerlandSyriaTaiwanThailandTrinidad and TobagoTurkeyUgandaUkraineUruguayUzbekistanVenezuelaVietnamWest IndiesWestern AfricaWestern AsiaWestern EuropeYemenZaireZimbabweAzores
Master's Degree
Income
Poverty
Unemployment
Labor Participation
Family Structure
Vehicle Availability
Education Level
Disability

Master's Degree Comparison

Slovenes

Tohono O'odham

Good
Tragic
15.5%
MASTER'S DEGREE
78.0/ 100
METRIC RATING
150th/ 347
METRIC RANK
9.7%
MASTER'S DEGREE
0.0/ 100
METRIC RATING
338th/ 347
METRIC RANK

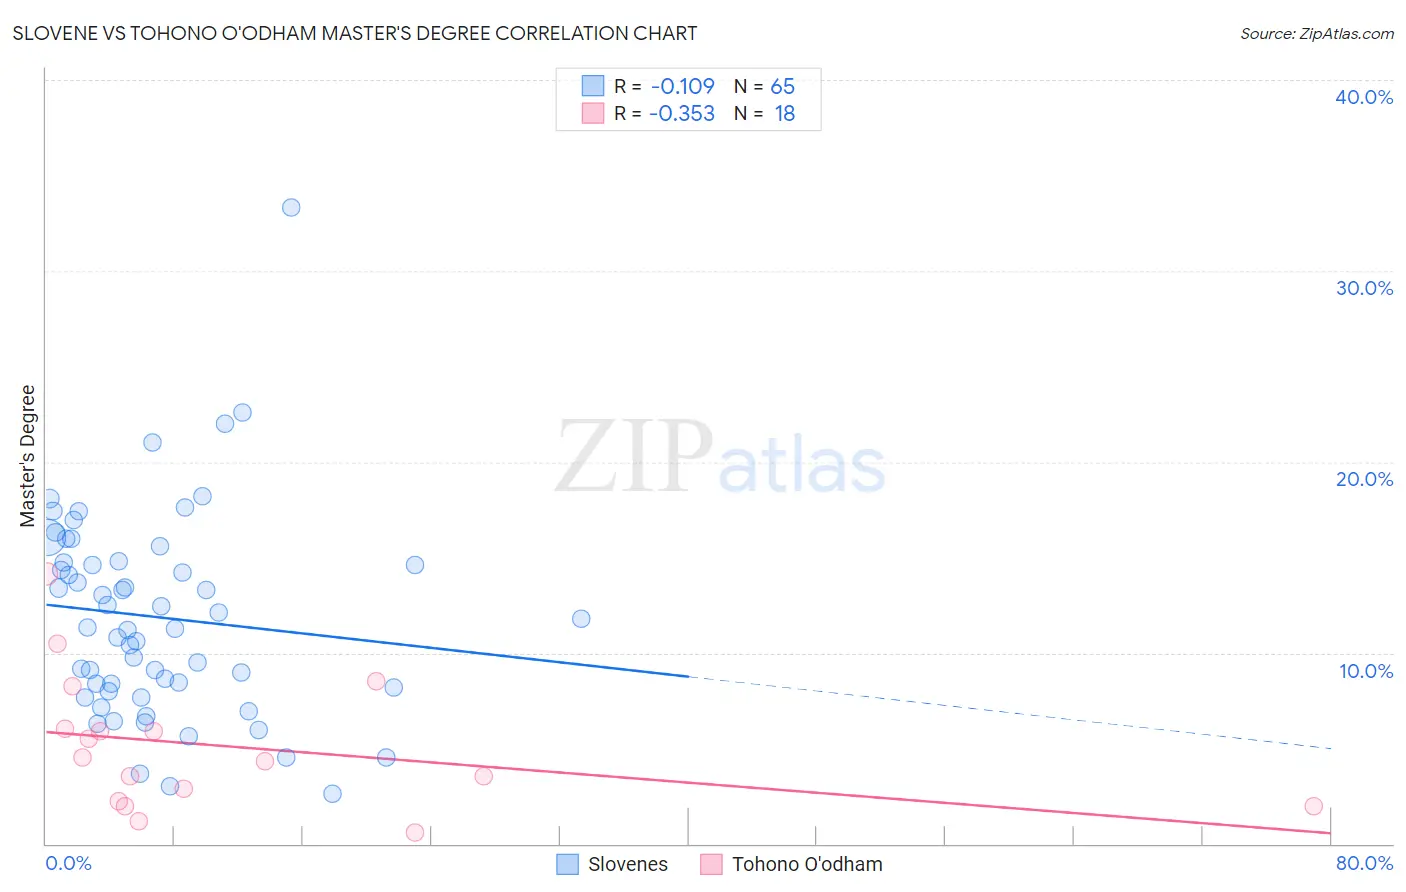
Slovene vs Tohono O'odham Master's Degree Correlation Chart

The statistical analysis conducted on geographies consisting of 261,310,088 people shows a poor negative correlation between the proportion of Slovenes and percentage of population with at least master's degree education in the United States with a correlation coefficient (R) of -0.109 and weighted average of 15.5%. Similarly, the statistical analysis conducted on geographies consisting of 58,714,512 people shows a mild negative correlation between the proportion of Tohono O'odham and percentage of population with at least master's degree education in the United States with a correlation coefficient (R) of -0.353 and weighted average of 9.7%, a difference of 60.0%.
Slovene vs Tohono O'odham Master's Degree

Master's Degree Correlation Summary

MeasurementSloveneTohono O'odham
Minimum2.6%0.61%
Maximum33.3%14.1%
Range30.7%13.5%
Mean11.9%5.1%
Median11.3%4.4%
Interquartile 25% (IQ1)8.1%2.3%
Interquartile 75% (IQ3)14.8%6.0%
Interquartile Range (IQR)6.7%3.7%
Standard Deviation (Sample)5.4%3.5%
Standard Deviation (Population)5.3%3.4%

Similar Demographics by Master's Degree

Demographics Similar to Slovenes by Master's Degree

In terms of master's degree, the demographic groups most similar to Slovenes are Ghanaian (15.5%, a difference of 0.030%), Immigrants from Senegal (15.5%, a difference of 0.040%), Iraqi (15.5%, a difference of 0.12%), Slavic (15.5%, a difference of 0.17%), and Icelander (15.5%, a difference of 0.20%).
DemographicsRating | RankMaster's Degree
Immigrants | Venezuela
83.6
/100
|
#143
Excellent
15.7%
Canadians
83.3
/100
|
#144
Excellent
15.7%
South Americans
81.3
/100
|
#145
Excellent
15.6%
Immigrants | Afghanistan
79.4
/100
|
#146
Good
15.6%
Hungarians
79.1
/100
|
#147
Good
15.6%
Immigrants | Senegal
78.2
/100
|
#148
Good
15.5%
Ghanaians
78.2
/100
|
#149
Good
15.5%
Slovenes
78.0
/100
|
#150
Good
15.5%
Iraqis
77.3
/100
|
#151
Good
15.5%
Slavs
77.0
/100
|
#152
Good
15.5%
Icelanders
76.8
/100
|
#153
Good
15.5%
Immigrants | South America
76.3
/100
|
#154
Good
15.5%
Immigrants | Bangladesh
76.1
/100
|
#155
Good
15.5%
Bermudans
73.9
/100
|
#156
Good
15.4%
Immigrants | Cameroon
71.7
/100
|
#157
Good
15.4%

Demographics Similar to Tohono O'odham by Master's Degree

In terms of master's degree, the demographic groups most similar to Tohono O'odham are Mexican (9.7%, a difference of 0.080%), Spanish American Indian (9.6%, a difference of 1.3%), Native/Alaskan (9.9%, a difference of 2.3%), Yakama (9.5%, a difference of 2.6%), and Immigrants from Central America (10.0%, a difference of 2.9%).
DemographicsRating | RankMaster's Degree
Pueblo
0.0
/100
|
#331
Tragic
10.3%
Immigrants | Azores
0.0
/100
|
#332
Tragic
10.2%
Menominee
0.0
/100
|
#333
Tragic
10.2%
Arapaho
0.0
/100
|
#334
Tragic
10.0%
Immigrants | Central America
0.0
/100
|
#335
Tragic
10.0%
Natives/Alaskans
0.0
/100
|
#336
Tragic
9.9%
Mexicans
0.0
/100
|
#337
Tragic
9.7%
Tohono O'odham
0.0
/100
|
#338
Tragic
9.7%
Spanish American Indians
0.0
/100
|
#339
Tragic
9.6%
Yakama
0.0
/100
|
#340
Tragic
9.5%
Navajo
0.0
/100
|
#341
Tragic
9.4%
Immigrants | Mexico
0.0
/100
|
#342
Tragic
9.3%
Lumbee
0.0
/100
|
#343
Tragic
9.3%
Pima
0.0
/100
|
#344
Tragic
9.2%
Yuman
0.0
/100
|
#345
Tragic
9.2%