Slovene vs French Canadian Professional Degree

COMPARE

Slovene
Race
Ancestry
AfghanAfricanAlaska NativeAlaskan AthabascanAlbanianAleutAlsatianAmericanApacheArabArapahoArgentineanArmenianAssyrian/Chaldean/SyriacAustralianAustrianBahamianBangladeshiBarbadianBasqueBelgianBelizeanBermudanBhutaneseBlackfeetBolivianBrazilianBritishBritish West IndianBulgarianBurmeseCajunCambodianCanadianCape VerdeanCarpatho RusynCelticCentral AmericanCentral American IndianCherokeeCheyenneChickasawChileanChineseChippewaChoctawColombianColvilleComancheCosta RicanCreeCreekCroatianCrowCubanCypriotCzechCzechoslovakianDanishDelawareDominicanDutchDutch West IndianEastern EuropeanEcuadorianEgyptianEnglishEstonianEthiopianEuropeanFijianFilipinoFinnishFrenchFrench American IndianGermanGerman RussianGhanaianGreekGuamanian/ChamorroGuatemalanGuyaneseHaitianHmongHonduranHopiHoumaHungarianIcelanderIndian (Asian)IndonesianInupiatIranianIraqiIrishIroquoisIsraeliItalianJamaicanJapaneseJordanianKenyanKiowaKoreanLaotianLatvianLebaneseLiberianLithuanianLumbeeLuxembourgerMacedonianMalaysianMalteseMarshalleseMenomineeMexicanMexican American IndianMongolianMoroccanNative HawaiianNavajoNepaleseNew ZealanderNicaraguanNigerianNorthern EuropeanNorwegianOkinawanOsageOttawaPaiutePakistaniPalestinianPanamanianParaguayanPennsylvania GermanPeruvianPimaPolishPortuguesePotawatomiPuebloPuerto RicanPuget Sound SalishRomanianRussianSalvadoranSamoanScandinavianScotch-IrishScottishSeminoleSenegaleseSerbianShoshoneSierra LeoneanSiouxSlavicSlovakSloveneSomaliSouth AfricanSouth AmericanSouth American IndianSoviet UnionSpaniardSpanishSpanish AmericanSpanish American IndianSri LankanSubsaharan AfricanSudaneseSwedishSwissSyrianTaiwaneseThaiTlingit-HaidaTohono O'OdhamTonganTrinidadian and TobagonianTsimshianTurkishU.S. Virgin IslanderUgandanUkrainianUruguayanUteVenezuelanVietnameseWelshWest IndianYakamaYaquiYugoslavianYumanYup'ikZimbabwean
Immigration
NonimmigrantsImmigrantsAfghanistanAfricaAlbaniaArgentinaArmeniaAsiaAustraliaAustriaBahamasBangladeshBarbadosBelarusBelgiumBelizeBoliviaBosnia and HerzegovinaBrazilBulgariaBurma/MyanmarCabo VerdeCambodiaCameroonCanadaCaribbeanCentral AmericaChileChinaColombiaCongoCosta RicaCroatiaCubaCzechoslovakiaDenmarkDominicaDominican RepublicEastern AfricaEastern AsiaEastern EuropeEcuadorEgyptEl SalvadorEnglandEritreaEthiopiaEuropeFijiFranceGermanyGhanaGreeceGrenadaGuatemalaGuyanaHaitiHondurasHong KongHungaryIndiaIndonesiaIranIraqIrelandIsraelItalyJamaicaJapanJordanKazakhstanKenyaKoreaKuwaitLaosLatin AmericaLatviaLebanonLiberiaLithuaniaMalaysiaMexicoMicronesiaMiddle AfricaMoldovaMoroccoNepalNetherlandsNicaraguaNigeriaNorth AmericaNorth MacedoniaNorthern AfricaNorthern EuropeNorwayOceaniaPakistanPanamaPeruPhilippinesPolandPortugalRomaniaRussiaSaudi ArabiaScotlandSenegalSerbiaSierra LeoneSingaporeSomaliaSouth AfricaSouth AmericaSouth Central AsiaSouth Eastern AsiaSouthern EuropeSpainSri LankaSt. Vincent and the GrenadinesSudanSwedenSwitzerlandSyriaTaiwanThailandTrinidad and TobagoTurkeyUgandaUkraineUruguayUzbekistanVenezuelaVietnamWest IndiesWestern AfricaWestern AsiaWestern EuropeYemenZaireZimbabweAzores
French Canadian
Race
Ancestry
AfghanAfricanAlaska NativeAlaskan AthabascanAlbanianAleutAlsatianAmericanApacheArabArapahoArgentineanArmenianAssyrian/Chaldean/SyriacAustralianAustrianBahamianBangladeshiBarbadianBasqueBelgianBelizeanBermudanBhutaneseBlackfeetBolivianBrazilianBritishBritish West IndianBulgarianBurmeseCajunCambodianCanadianCape VerdeanCarpatho RusynCelticCentral AmericanCentral American IndianCherokeeCheyenneChickasawChileanChineseChippewaChoctawColombianColvilleComancheCosta RicanCreeCreekCroatianCrowCubanCypriotCzechCzechoslovakianDanishDelawareDominicanDutchDutch West IndianEastern EuropeanEcuadorianEgyptianEnglishEstonianEthiopianEuropeanFijianFilipinoFinnishFrenchFrench American IndianFrench CanadianGermanGerman RussianGhanaianGreekGuamanian/ChamorroGuatemalanGuyaneseHaitianHmongHonduranHopiHoumaHungarianIcelanderIndian (Asian)IndonesianInupiatIranianIraqiIrishIroquoisIsraeliItalianJamaicanJapaneseJordanianKenyanKiowaKoreanLaotianLatvianLebaneseLiberianLithuanianLumbeeLuxembourgerMacedonianMalaysianMalteseMarshalleseMenomineeMexicanMexican American IndianMongolianMoroccanNative HawaiianNavajoNepaleseNew ZealanderNicaraguanNigerianNorthern EuropeanNorwegianOkinawanOsageOttawaPaiutePakistaniPalestinianPanamanianParaguayanPennsylvania GermanPeruvianPimaPolishPortuguesePotawatomiPuebloPuerto RicanPuget Sound SalishRomanianRussianSalvadoranSamoanScandinavianScotch-IrishScottishSeminoleSenegaleseSerbianShoshoneSierra LeoneanSiouxSlavicSlovakSomaliSouth AfricanSouth AmericanSouth American IndianSoviet UnionSpaniardSpanishSpanish AmericanSpanish American IndianSri LankanSubsaharan AfricanSudaneseSwedishSwissSyrianTaiwaneseThaiTlingit-HaidaTohono O'OdhamTonganTrinidadian and TobagonianTsimshianTurkishU.S. Virgin IslanderUgandanUkrainianUruguayanUteVenezuelanVietnameseWelshWest IndianYakamaYaquiYugoslavianYumanYup'ikZimbabwean
Immigration
NonimmigrantsImmigrantsAfghanistanAfricaAlbaniaArgentinaArmeniaAsiaAustraliaAustriaBahamasBangladeshBarbadosBelarusBelgiumBelizeBoliviaBosnia and HerzegovinaBrazilBulgariaBurma/MyanmarCabo VerdeCambodiaCameroonCanadaCaribbeanCentral AmericaChileChinaColombiaCongoCosta RicaCroatiaCubaCzechoslovakiaDenmarkDominicaDominican RepublicEastern AfricaEastern AsiaEastern EuropeEcuadorEgyptEl SalvadorEnglandEritreaEthiopiaEuropeFijiFranceGermanyGhanaGreeceGrenadaGuatemalaGuyanaHaitiHondurasHong KongHungaryIndiaIndonesiaIranIraqIrelandIsraelItalyJamaicaJapanJordanKazakhstanKenyaKoreaKuwaitLaosLatin AmericaLatviaLebanonLiberiaLithuaniaMalaysiaMexicoMicronesiaMiddle AfricaMoldovaMoroccoNepalNetherlandsNicaraguaNigeriaNorth AmericaNorth MacedoniaNorthern AfricaNorthern EuropeNorwayOceaniaPakistanPanamaPeruPhilippinesPolandPortugalRomaniaRussiaSaudi ArabiaScotlandSenegalSerbiaSierra LeoneSingaporeSomaliaSouth AfricaSouth AmericaSouth Central AsiaSouth Eastern AsiaSouthern EuropeSpainSri LankaSt. Vincent and the GrenadinesSudanSwedenSwitzerlandSyriaTaiwanThailandTrinidad and TobagoTurkeyUgandaUkraineUruguayUzbekistanVenezuelaVietnamWest IndiesWestern AfricaWestern AsiaWestern EuropeYemenZaireZimbabweAzores
Professional Degree
Income
Poverty
Unemployment
Labor Participation
Family Structure
Vehicle Availability
Education Level
Disability

Professional Degree Comparison

Slovenes

French Canadians

Good
Tragic
4.6%
PROFESSIONAL DEGREE
76.1/ 100
METRIC RATING
148th/ 347
METRIC RANK
4.0%
PROFESSIONAL DEGREE
8.0/ 100
METRIC RATING
221st/ 347
METRIC RANK

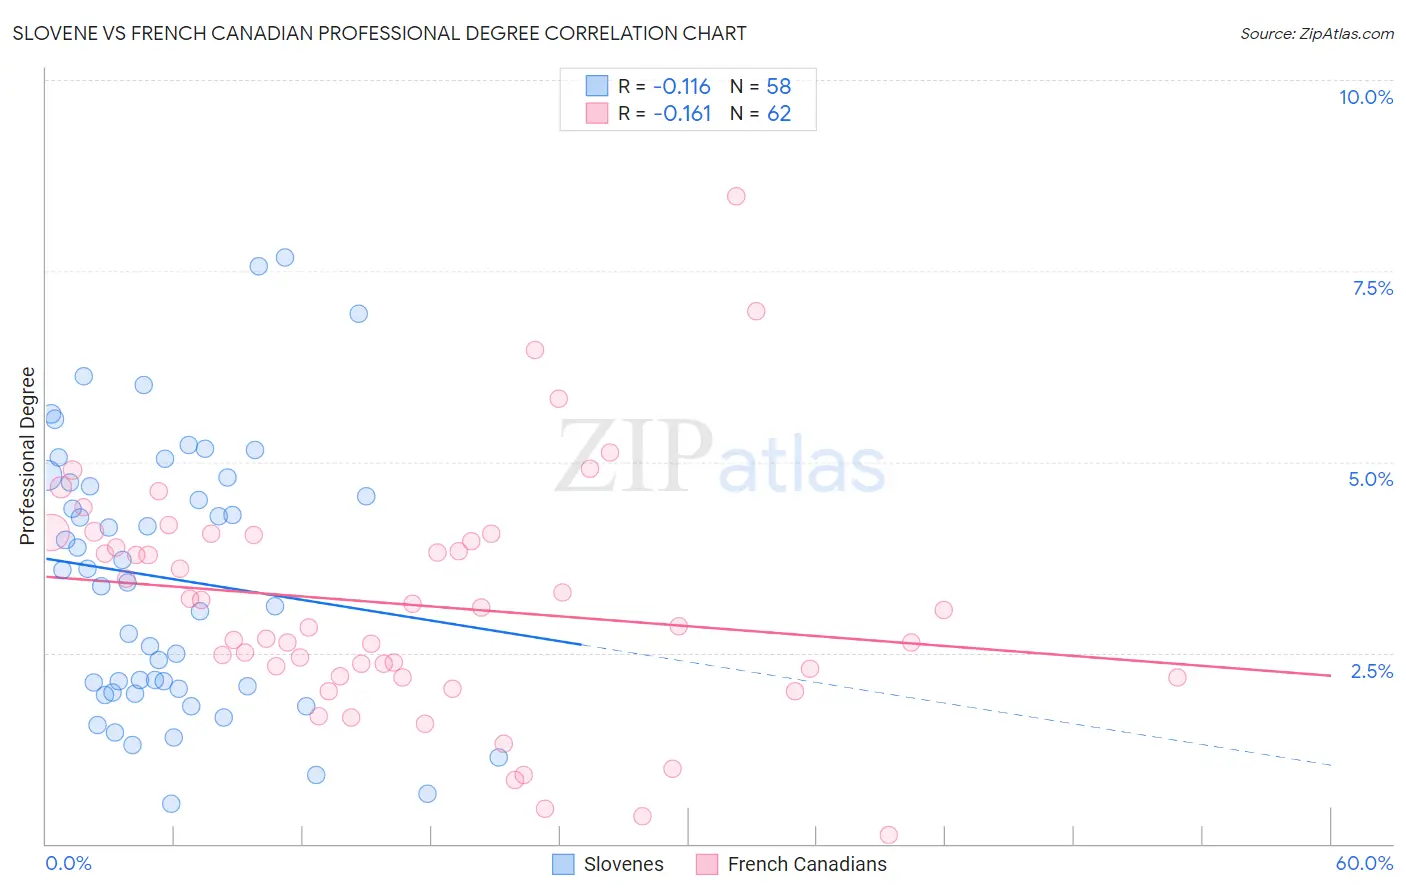
Slovene vs French Canadian Professional Degree Correlation Chart

The statistical analysis conducted on geographies consisting of 260,948,724 people shows a poor negative correlation between the proportion of Slovenes and percentage of population with at least professional degree education in the United States with a correlation coefficient (R) of -0.116 and weighted average of 4.6%. Similarly, the statistical analysis conducted on geographies consisting of 499,387,029 people shows a poor negative correlation between the proportion of French Canadians and percentage of population with at least professional degree education in the United States with a correlation coefficient (R) of -0.161 and weighted average of 4.0%, a difference of 14.4%.
Slovene vs French Canadian Professional Degree

Professional Degree Correlation Summary

MeasurementSloveneFrench Canadian
Minimum0.52%0.11%
Maximum7.7%8.5%
Range7.2%8.4%
Mean3.5%3.1%
Median3.5%3.0%
Interquartile 25% (IQ1)2.0%2.2%
Interquartile 75% (IQ3)4.7%4.0%
Interquartile Range (IQR)2.7%1.8%
Standard Deviation (Sample)1.7%1.6%
Standard Deviation (Population)1.7%1.5%

Similar Demographics by Professional Degree

Demographics Similar to Slovenes by Professional Degree

In terms of professional degree, the demographic groups most similar to Slovenes are Senegalese (4.6%, a difference of 0.14%), Colombian (4.6%, a difference of 0.32%), Immigrants from Oceania (4.6%, a difference of 0.50%), Luxembourger (4.6%, a difference of 0.53%), and Polish (4.6%, a difference of 0.64%).
DemographicsRating | RankProfessional Degree
Basques
81.8
/100
|
#141
Excellent
4.6%
Sudanese
81.3
/100
|
#142
Excellent
4.6%
Hungarians
80.8
/100
|
#143
Excellent
4.6%
Immigrants | South America
80.5
/100
|
#144
Excellent
4.6%
Uruguayans
80.2
/100
|
#145
Excellent
4.6%
Luxembourgers
78.7
/100
|
#146
Good
4.6%
Colombians
77.7
/100
|
#147
Good
4.6%
Slovenes
76.1
/100
|
#148
Good
4.6%
Senegalese
75.3
/100
|
#149
Good
4.6%
Immigrants | Oceania
73.4
/100
|
#150
Good
4.6%
Poles
72.6
/100
|
#151
Good
4.6%
Immigrants | Africa
72.5
/100
|
#152
Good
4.6%
Immigrants | Uruguay
72.5
/100
|
#153
Good
4.6%
Scottish
71.8
/100
|
#154
Good
4.6%
Slavs
70.8
/100
|
#155
Good
4.5%

Demographics Similar to French Canadians by Professional Degree

In terms of professional degree, the demographic groups most similar to French Canadians are Ute (4.0%, a difference of 0.13%), Immigrants from Western Africa (4.0%, a difference of 0.25%), Immigrants from Bosnia and Herzegovina (4.0%, a difference of 0.33%), Trinidadian and Tobagonian (4.0%, a difference of 0.47%), and Immigrants from South Eastern Asia (4.0%, a difference of 0.49%).
DemographicsRating | RankProfessional Degree
Immigrants | Ghana
10.6
/100
|
#214
Poor
4.1%
Portuguese
10.5
/100
|
#215
Poor
4.1%
West Indians
9.8
/100
|
#216
Tragic
4.1%
Immigrants | Vietnam
9.4
/100
|
#217
Tragic
4.0%
Dutch
9.0
/100
|
#218
Tragic
4.0%
Immigrants | South Eastern Asia
8.9
/100
|
#219
Tragic
4.0%
Ute
8.2
/100
|
#220
Tragic
4.0%
French Canadians
8.0
/100
|
#221
Tragic
4.0%
Immigrants | Western Africa
7.5
/100
|
#222
Tragic
4.0%
Immigrants | Bosnia and Herzegovina
7.4
/100
|
#223
Tragic
4.0%
Trinidadians and Tobagonians
7.1
/100
|
#224
Tragic
4.0%
Tlingit-Haida
6.9
/100
|
#225
Tragic
4.0%
German Russians
6.1
/100
|
#226
Tragic
4.0%
Cubans
5.9
/100
|
#227
Tragic
4.0%
Immigrants | West Indies
5.6
/100
|
#228
Tragic
4.0%