Slovak vs Panamanian Associate's Degree
COMPARE
Slovak
Panamanian
Associate's Degree
Associate's Degree Comparison
Slovaks
Panamanians
46.3%
ASSOCIATE'S DEGREE
48.4/ 100
METRIC RATING
177th/ 347
METRIC RANK
45.1%
ASSOCIATE'S DEGREE
18.4/ 100
METRIC RATING
207th/ 347
METRIC RANK
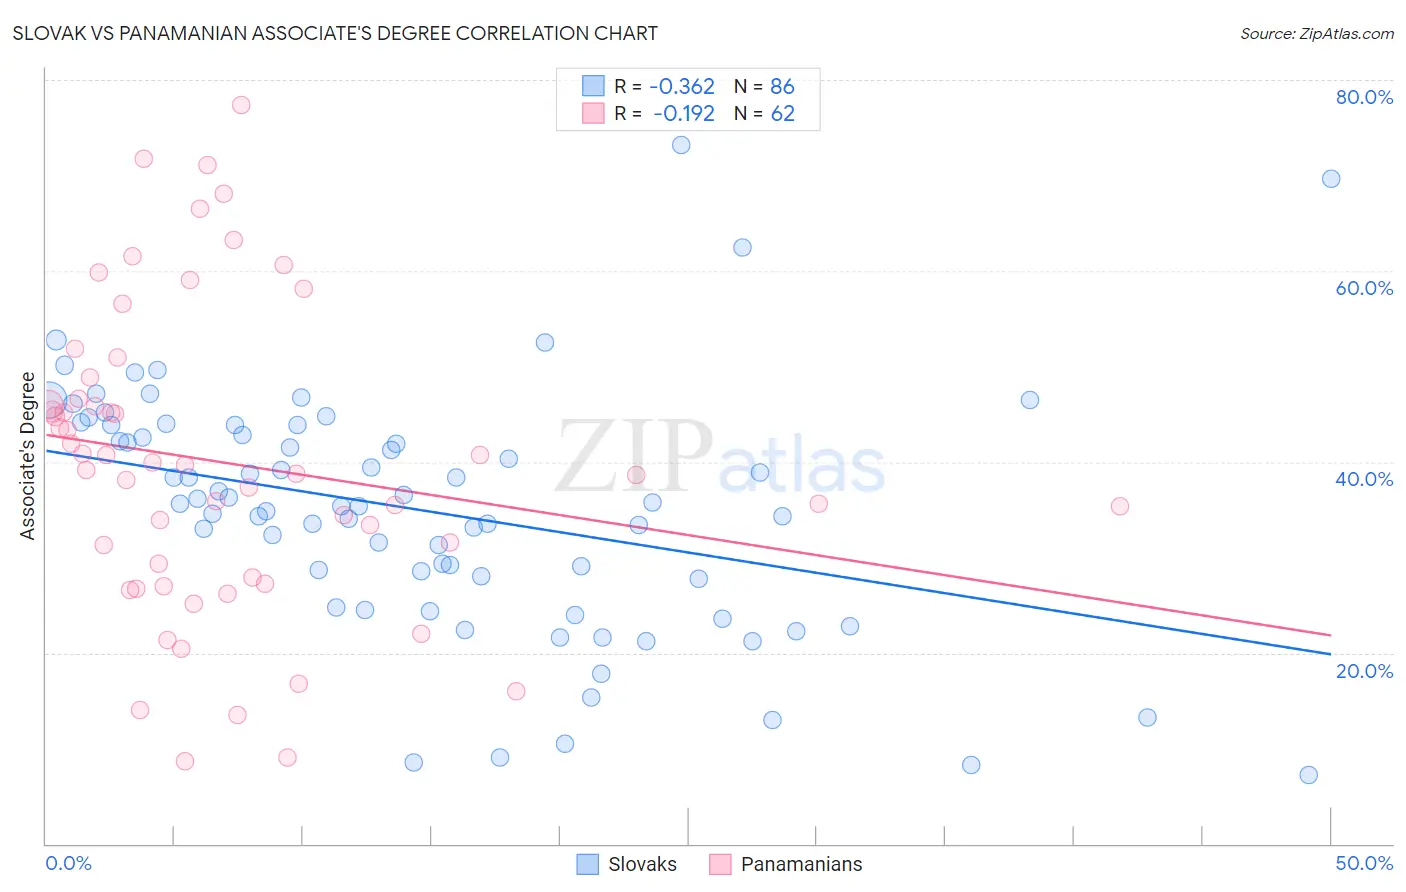
Slovak vs Panamanian Associate's Degree Correlation Chart
The statistical analysis conducted on geographies consisting of 397,875,693 people shows a mild negative correlation between the proportion of Slovaks and percentage of population with at least associate's degree education in the United States with a correlation coefficient (R) of -0.362 and weighted average of 46.3%. Similarly, the statistical analysis conducted on geographies consisting of 281,234,684 people shows a poor negative correlation between the proportion of Panamanians and percentage of population with at least associate's degree education in the United States with a correlation coefficient (R) of -0.192 and weighted average of 45.1%, a difference of 2.7%.
Associate's Degree Correlation Summary
| Measurement | Slovak | Panamanian |
| Minimum | 7.1% | 8.6% |
| Maximum | 73.2% | 77.4% |
| Range | 66.0% | 68.8% |
| Mean | 34.9% | 39.9% |
| Median | 35.4% | 39.4% |
| Interquartile 25% (IQ1) | 27.8% | 27.9% |
| Interquartile 75% (IQ3) | 43.8% | 46.6% |
| Interquartile Range (IQR) | 16.1% | 18.7% |
| Standard Deviation (Sample) | 12.8% | 15.9% |
| Standard Deviation (Population) | 12.7% | 15.8% |
Similar Demographics by Associate's Degree
Demographics Similar to Slovaks by Associate's Degree
In terms of associate's degree, the demographic groups most similar to Slovaks are Finnish (46.3%, a difference of 0.010%), Immigrants from Bosnia and Herzegovina (46.3%, a difference of 0.010%), Belgian (46.3%, a difference of 0.040%), Sri Lankan (46.3%, a difference of 0.060%), and English (46.4%, a difference of 0.12%).
| Demographics | Rating | Rank | Associate's Degree |
| Irish | 53.6 /100 | #170 | Average 46.5% |
| Basques | 52.8 /100 | #171 | Average 46.5% |
| Peruvians | 50.5 /100 | #172 | Average 46.4% |
| Immigrants | Iraq | 50.3 /100 | #173 | Average 46.4% |
| English | 50.0 /100 | #174 | Average 46.4% |
| Belgians | 48.9 /100 | #175 | Average 46.3% |
| Finns | 48.5 /100 | #176 | Average 46.3% |
| Slovaks | 48.4 /100 | #177 | Average 46.3% |
| Immigrants | Bosnia and Herzegovina | 48.3 /100 | #178 | Average 46.3% |
| Sri Lankans | 47.6 /100 | #179 | Average 46.3% |
| Bermudans | 46.4 /100 | #180 | Average 46.2% |
| Immigrants | Colombia | 41.3 /100 | #181 | Average 46.0% |
| Swiss | 40.4 /100 | #182 | Average 46.0% |
| Yugoslavians | 40.2 /100 | #183 | Average 46.0% |
| Czechoslovakians | 40.0 /100 | #184 | Average 46.0% |
Demographics Similar to Panamanians by Associate's Degree
In terms of associate's degree, the demographic groups most similar to Panamanians are Immigrants from Thailand (45.1%, a difference of 0.070%), German Russian (45.1%, a difference of 0.070%), Nigerian (45.1%, a difference of 0.090%), Dutch (45.0%, a difference of 0.10%), and Immigrants from Costa Rica (45.0%, a difference of 0.22%).
| Demographics | Rating | Rank | Associate's Degree |
| Senegalese | 21.1 /100 | #200 | Fair 45.2% |
| Immigrants | Vietnam | 20.8 /100 | #201 | Fair 45.2% |
| Spaniards | 20.4 /100 | #202 | Fair 45.2% |
| Immigrants | South Eastern Asia | 20.2 /100 | #203 | Fair 45.2% |
| Nigerians | 19.1 /100 | #204 | Poor 45.1% |
| Immigrants | Thailand | 18.9 /100 | #205 | Poor 45.1% |
| German Russians | 18.9 /100 | #206 | Poor 45.1% |
| Panamanians | 18.4 /100 | #207 | Poor 45.1% |
| Dutch | 17.6 /100 | #208 | Poor 45.0% |
| Immigrants | Costa Rica | 16.7 /100 | #209 | Poor 45.0% |
| Immigrants | Philippines | 16.7 /100 | #210 | Poor 45.0% |
| Immigrants | Zaire | 16.6 /100 | #211 | Poor 45.0% |
| French Canadians | 15.0 /100 | #212 | Poor 44.9% |
| Immigrants | Ghana | 14.2 /100 | #213 | Poor 44.8% |
| Immigrants | Middle Africa | 12.7 /100 | #214 | Poor 44.7% |