Slavic vs Immigrants from Central America 1st Grade
COMPARE
Slavic
Immigrants from Central America
1st Grade
1st Grade Comparison
Slavs
Immigrants from Central America
98.4%
1ST GRADE
99.7/ 100
METRIC RATING
62nd/ 347
METRIC RANK
96.3%
1ST GRADE
0.0/ 100
METRIC RATING
341st/ 347
METRIC RANK
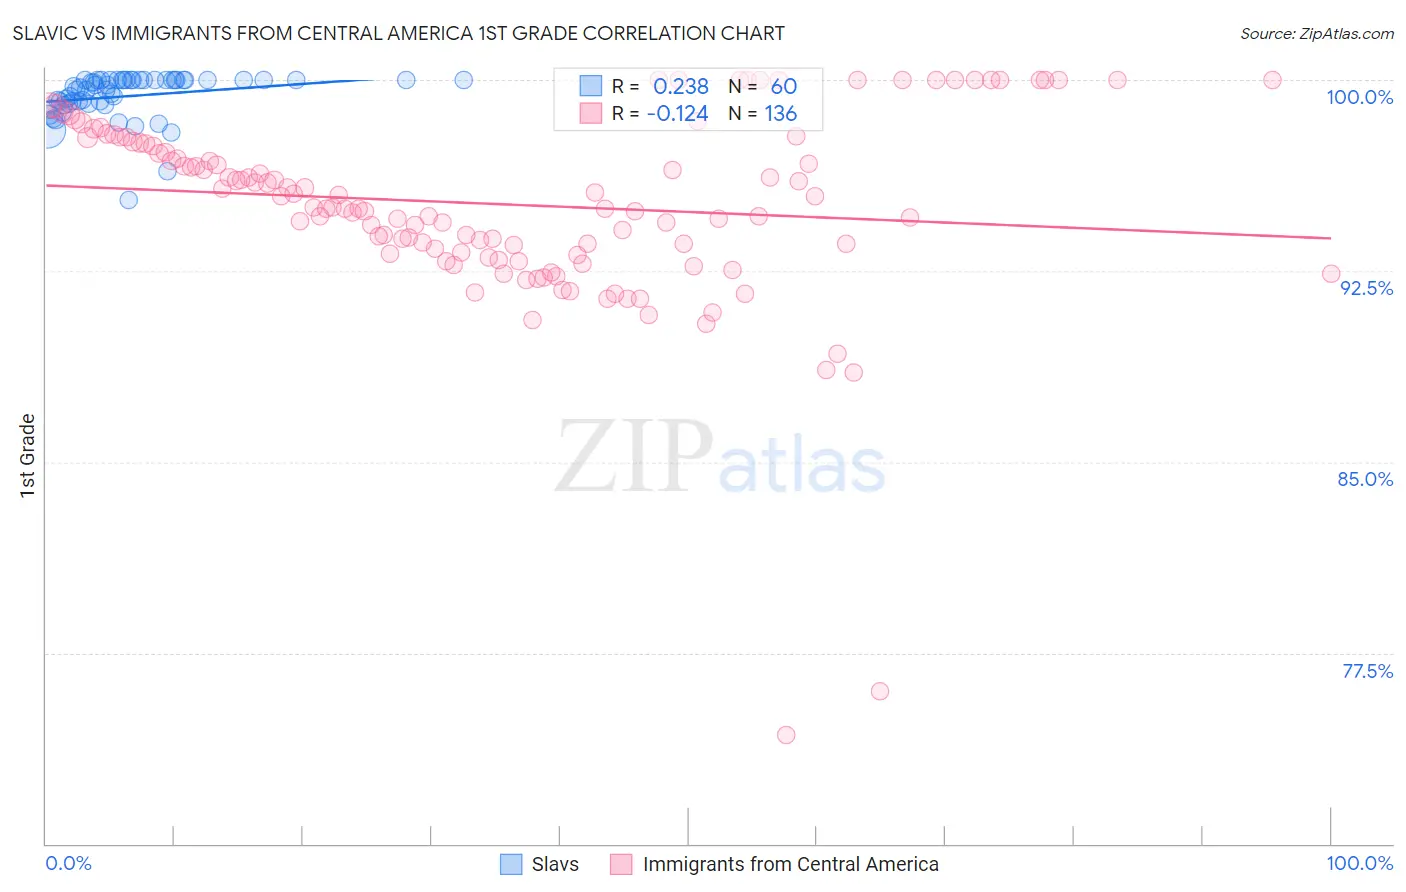
Slavic vs Immigrants from Central America 1st Grade Correlation Chart
The statistical analysis conducted on geographies consisting of 270,869,056 people shows a weak positive correlation between the proportion of Slavs and percentage of population with at least 1st grade education in the United States with a correlation coefficient (R) of 0.238 and weighted average of 98.4%. Similarly, the statistical analysis conducted on geographies consisting of 536,554,221 people shows a poor negative correlation between the proportion of Immigrants from Central America and percentage of population with at least 1st grade education in the United States with a correlation coefficient (R) of -0.124 and weighted average of 96.3%, a difference of 2.1%.
1st Grade Correlation Summary
| Measurement | Slavic | Immigrants from Central America |
| Minimum | 95.3% | 74.3% |
| Maximum | 100.0% | 100.0% |
| Range | 4.7% | 25.7% |
| Mean | 99.4% | 95.1% |
| Median | 99.7% | 95.0% |
| Interquartile 25% (IQ1) | 99.1% | 93.2% |
| Interquartile 75% (IQ3) | 100.0% | 97.6% |
| Interquartile Range (IQR) | 0.93% | 4.4% |
| Standard Deviation (Sample) | 0.90% | 3.7% |
| Standard Deviation (Population) | 0.90% | 3.7% |
Similar Demographics by 1st Grade
Demographics Similar to Slavs by 1st Grade
In terms of 1st grade, the demographic groups most similar to Slavs are New Zealander (98.4%, a difference of 0.0%), Creek (98.4%, a difference of 0.0%), Immigrants from Canada (98.4%, a difference of 0.0%), Bulgarian (98.4%, a difference of 0.0%), and Immigrants from North America (98.4%, a difference of 0.0%).
| Demographics | Rating | Rank | 1st Grade |
| Immigrants | Scotland | 99.8 /100 | #55 | Exceptional 98.4% |
| Americans | 99.8 /100 | #56 | Exceptional 98.4% |
| Austrians | 99.8 /100 | #57 | Exceptional 98.4% |
| New Zealanders | 99.7 /100 | #58 | Exceptional 98.4% |
| Creek | 99.7 /100 | #59 | Exceptional 98.4% |
| Immigrants | Canada | 99.7 /100 | #60 | Exceptional 98.4% |
| Bulgarians | 99.7 /100 | #61 | Exceptional 98.4% |
| Slavs | 99.7 /100 | #62 | Exceptional 98.4% |
| Immigrants | North America | 99.7 /100 | #63 | Exceptional 98.4% |
| Greeks | 99.7 /100 | #64 | Exceptional 98.4% |
| Maltese | 99.7 /100 | #65 | Exceptional 98.4% |
| Canadians | 99.6 /100 | #66 | Exceptional 98.3% |
| Immigrants | Austria | 99.6 /100 | #67 | Exceptional 98.3% |
| Immigrants | Northern Europe | 99.6 /100 | #68 | Exceptional 98.3% |
| Chickasaw | 99.6 /100 | #69 | Exceptional 98.3% |
Demographics Similar to Immigrants from Central America by 1st Grade
In terms of 1st grade, the demographic groups most similar to Immigrants from Central America are Immigrants from Cabo Verde (96.3%, a difference of 0.020%), Immigrants from Mexico (96.3%, a difference of 0.030%), Immigrants from Guatemala (96.4%, a difference of 0.040%), Salvadoran (96.3%, a difference of 0.060%), and Immigrants from Fiji (96.4%, a difference of 0.11%).
| Demographics | Rating | Rank | 1st Grade |
| Immigrants | Dominican Republic | 0.0 /100 | #333 | Tragic 96.5% |
| Bangladeshis | 0.0 /100 | #334 | Tragic 96.5% |
| Yakama | 0.0 /100 | #335 | Tragic 96.5% |
| Guatemalans | 0.0 /100 | #336 | Tragic 96.5% |
| Immigrants | Cambodia | 0.0 /100 | #337 | Tragic 96.5% |
| Immigrants | Fiji | 0.0 /100 | #338 | Tragic 96.4% |
| Immigrants | Guatemala | 0.0 /100 | #339 | Tragic 96.4% |
| Immigrants | Cabo Verde | 0.0 /100 | #340 | Tragic 96.3% |
| Immigrants | Central America | 0.0 /100 | #341 | Tragic 96.3% |
| Immigrants | Mexico | 0.0 /100 | #342 | Tragic 96.3% |
| Salvadorans | 0.0 /100 | #343 | Tragic 96.3% |
| Nepalese | 0.0 /100 | #344 | Tragic 96.1% |
| Immigrants | El Salvador | 0.0 /100 | #345 | Tragic 96.1% |
| Immigrants | Yemen | 0.0 /100 | #346 | Tragic 95.8% |
| Spanish American Indians | 0.0 /100 | #347 | Tragic 95.7% |