Sioux vs Immigrants from Germany Nursery School

COMPARE

Sioux
Race
Ancestry
AfghanAfricanAlaska NativeAlaskan AthabascanAlbanianAleutAlsatianAmericanApacheArabArapahoArgentineanArmenianAssyrian/Chaldean/SyriacAustralianAustrianBahamianBangladeshiBarbadianBasqueBelgianBelizeanBermudanBhutaneseBlackfeetBolivianBrazilianBritishBritish West IndianBulgarianBurmeseCajunCambodianCanadianCape VerdeanCarpatho RusynCelticCentral AmericanCentral American IndianCherokeeCheyenneChickasawChileanChineseChippewaChoctawColombianColvilleComancheCosta RicanCreeCreekCroatianCrowCubanCypriotCzechCzechoslovakianDanishDelawareDominicanDutchDutch West IndianEastern EuropeanEcuadorianEgyptianEnglishEstonianEthiopianEuropeanFijianFilipinoFinnishFrenchFrench American IndianFrench CanadianGermanGerman RussianGhanaianGreekGuamanian/ChamorroGuatemalanGuyaneseHaitianHmongHonduranHopiHoumaHungarianIcelanderIndian (Asian)IndonesianInupiatIranianIraqiIrishIroquoisIsraeliItalianJamaicanJapaneseJordanianKenyanKiowaKoreanLaotianLatvianLebaneseLiberianLithuanianLumbeeLuxembourgerMacedonianMalaysianMalteseMarshalleseMenomineeMexicanMexican American IndianMongolianMoroccanNative HawaiianNavajoNepaleseNew ZealanderNicaraguanNigerianNorthern EuropeanNorwegianOkinawanOsageOttawaPaiutePakistaniPalestinianPanamanianParaguayanPennsylvania GermanPeruvianPimaPolishPortuguesePotawatomiPuebloPuerto RicanPuget Sound SalishRomanianRussianSalvadoranSamoanScandinavianScotch-IrishScottishSeminoleSenegaleseSerbianShoshoneSierra LeoneanSiouxSlavicSlovakSloveneSomaliSouth AfricanSouth AmericanSouth American IndianSoviet UnionSpaniardSpanishSpanish AmericanSpanish American IndianSri LankanSubsaharan AfricanSudaneseSwedishSwissSyrianTaiwaneseThaiTlingit-HaidaTohono O'OdhamTonganTrinidadian and TobagonianTsimshianTurkishU.S. Virgin IslanderUgandanUkrainianUruguayanUteVenezuelanVietnameseWelshWest IndianYakamaYaquiYugoslavianYumanYup'ikZimbabwean
Immigration
NonimmigrantsImmigrantsAfghanistanAfricaAlbaniaArgentinaArmeniaAsiaAustraliaAustriaBahamasBangladeshBarbadosBelarusBelgiumBelizeBoliviaBosnia and HerzegovinaBrazilBulgariaBurma/MyanmarCabo VerdeCambodiaCameroonCanadaCaribbeanCentral AmericaChileChinaColombiaCongoCosta RicaCroatiaCubaCzechoslovakiaDenmarkDominicaDominican RepublicEastern AfricaEastern AsiaEastern EuropeEcuadorEgyptEl SalvadorEnglandEritreaEthiopiaEuropeFijiFranceGhanaGreeceGrenadaGuatemalaGuyanaHaitiHondurasHong KongHungaryIndiaIndonesiaIranIraqIrelandIsraelItalyJamaicaJapanJordanKazakhstanKenyaKoreaKuwaitLaosLatin AmericaLatviaLebanonLiberiaLithuaniaMalaysiaMexicoMicronesiaMiddle AfricaMoldovaMoroccoNepalNetherlandsNicaraguaNigeriaNorth AmericaNorth MacedoniaNorthern AfricaNorthern EuropeNorwayOceaniaPakistanPanamaPeruPhilippinesPolandPortugalRomaniaRussiaSaudi ArabiaScotlandSenegalSerbiaSierra LeoneSingaporeSomaliaSouth AfricaSouth AmericaSouth Central AsiaSouth Eastern AsiaSouthern EuropeSpainSri LankaSt. Vincent and the GrenadinesSudanSwedenSwitzerlandSyriaTaiwanThailandTrinidad and TobagoTurkeyUgandaUkraineUruguayUzbekistanVenezuelaVietnamWest IndiesWestern AfricaWestern AsiaWestern EuropeYemenZaireZimbabweAzores
Immigrants from Germany
Race
Ancestry
AfghanAfricanAlaska NativeAlaskan AthabascanAlbanianAleutAlsatianAmericanApacheArabArapahoArgentineanArmenianAssyrian/Chaldean/SyriacAustralianAustrianBahamianBangladeshiBarbadianBasqueBelgianBelizeanBermudanBhutaneseBlackfeetBolivianBrazilianBritishBritish West IndianBulgarianBurmeseCajunCambodianCanadianCape VerdeanCarpatho RusynCelticCentral AmericanCentral American IndianCherokeeCheyenneChickasawChileanChineseChippewaChoctawColombianColvilleComancheCosta RicanCreeCreekCroatianCrowCubanCypriotCzechCzechoslovakianDanishDelawareDominicanDutchDutch West IndianEastern EuropeanEcuadorianEgyptianEnglishEstonianEthiopianEuropeanFijianFilipinoFinnishFrenchFrench American IndianFrench CanadianGermanGerman RussianGhanaianGreekGuamanian/ChamorroGuatemalanGuyaneseHaitianHmongHonduranHopiHoumaHungarianIcelanderIndian (Asian)IndonesianInupiatIranianIraqiIrishIroquoisIsraeliItalianJamaicanJapaneseJordanianKenyanKiowaKoreanLaotianLatvianLebaneseLiberianLithuanianLumbeeLuxembourgerMacedonianMalaysianMalteseMarshalleseMenomineeMexicanMexican American IndianMongolianMoroccanNative HawaiianNavajoNepaleseNew ZealanderNicaraguanNigerianNorthern EuropeanNorwegianOkinawanOsageOttawaPaiutePakistaniPalestinianPanamanianParaguayanPennsylvania GermanPeruvianPimaPolishPortuguesePotawatomiPuebloPuerto RicanPuget Sound SalishRomanianRussianSalvadoranSamoanScandinavianScotch-IrishScottishSeminoleSenegaleseSerbianShoshoneSierra LeoneanSlavicSlovakSloveneSomaliSouth AfricanSouth AmericanSouth American IndianSoviet UnionSpaniardSpanishSpanish AmericanSpanish American IndianSri LankanSubsaharan AfricanSudaneseSwedishSwissSyrianTaiwaneseThaiTlingit-HaidaTohono O'OdhamTonganTrinidadian and TobagonianTsimshianTurkishU.S. Virgin IslanderUgandanUkrainianUruguayanUteVenezuelanVietnameseWelshWest IndianYakamaYaquiYugoslavianYumanYup'ikZimbabwean
Immigration
NonimmigrantsImmigrantsAfghanistanAfricaAlbaniaArgentinaArmeniaAsiaAustraliaAustriaBahamasBangladeshBarbadosBelarusBelgiumBelizeBoliviaBosnia and HerzegovinaBrazilBulgariaBurma/MyanmarCabo VerdeCambodiaCameroonCanadaCaribbeanCentral AmericaChileChinaColombiaCongoCosta RicaCroatiaCubaCzechoslovakiaDenmarkDominicaDominican RepublicEastern AfricaEastern AsiaEastern EuropeEcuadorEgyptEl SalvadorEnglandEritreaEthiopiaEuropeFijiFranceGermanyGhanaGreeceGrenadaGuatemalaGuyanaHaitiHondurasHong KongHungaryIndiaIndonesiaIranIraqIrelandIsraelItalyJamaicaJapanJordanKazakhstanKenyaKoreaKuwaitLaosLatin AmericaLatviaLebanonLiberiaLithuaniaMalaysiaMexicoMicronesiaMiddle AfricaMoldovaMoroccoNepalNetherlandsNicaraguaNigeriaNorth AmericaNorth MacedoniaNorthern AfricaNorthern EuropeNorwayOceaniaPakistanPanamaPeruPhilippinesPolandPortugalRomaniaRussiaSaudi ArabiaScotlandSenegalSerbiaSierra LeoneSingaporeSomaliaSouth AfricaSouth AmericaSouth Central AsiaSouth Eastern AsiaSouthern EuropeSpainSri LankaSt. Vincent and the GrenadinesSudanSwedenSwitzerlandSyriaTaiwanThailandTrinidad and TobagoTurkeyUgandaUkraineUruguayUzbekistanVenezuelaVietnamWest IndiesWestern AfricaWestern AsiaWestern EuropeYemenZaireZimbabweAzores
Nursery School
Income
Poverty
Unemployment
Labor Participation
Family Structure
Vehicle Availability
Education Level
Disability

Nursery School Comparison

Sioux

Immigrants from Germany

Exceptional
Exceptional
98.6%
NURSERY SCHOOL
100.0/ 100
METRIC RATING
26th/ 347
METRIC RANK
98.3%
NURSERY SCHOOL
98.6/ 100
METRIC RATING
94th/ 347
METRIC RANK

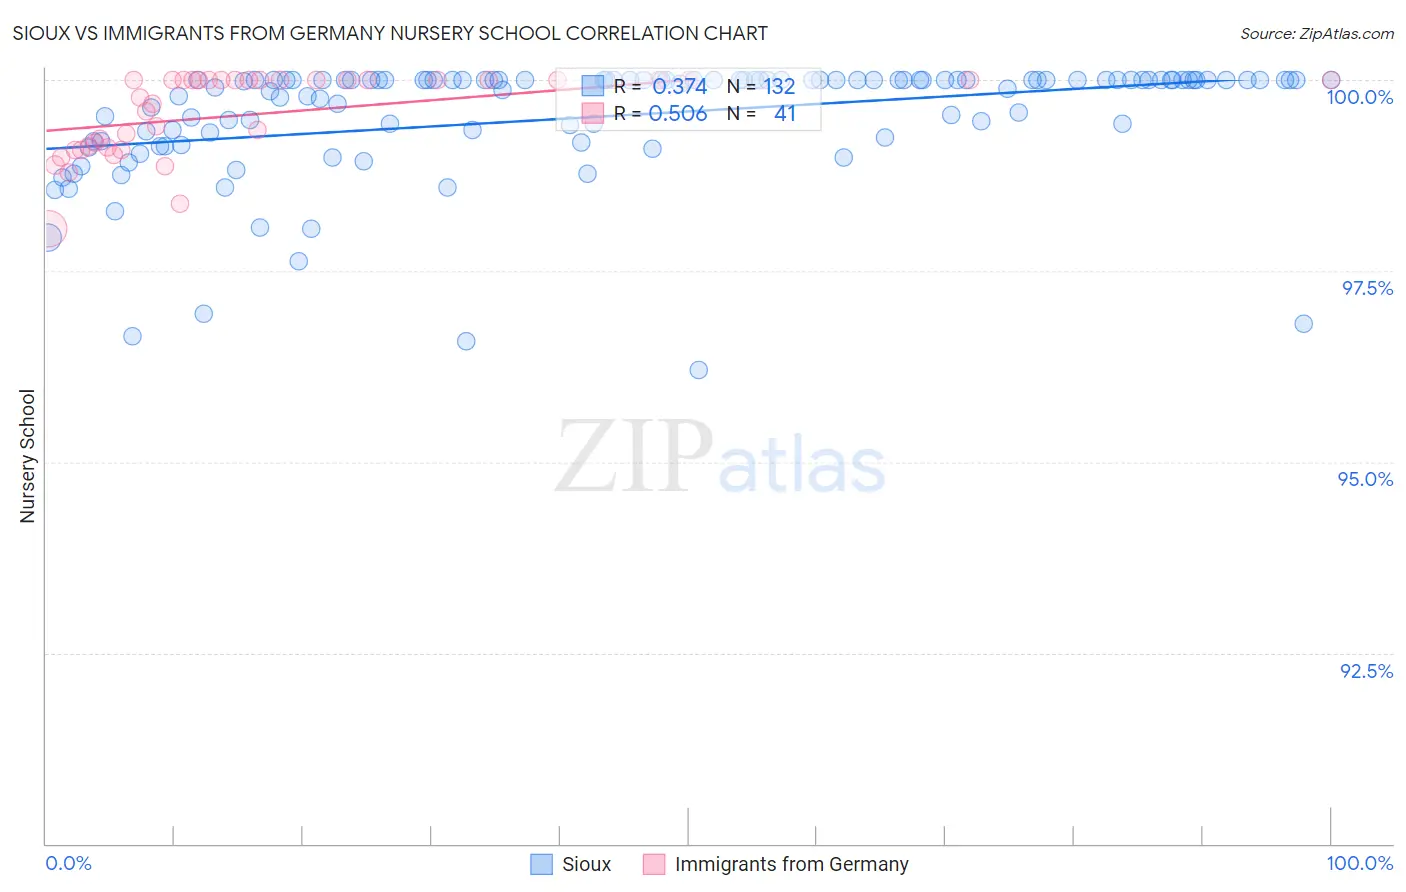
Sioux vs Immigrants from Germany Nursery School Correlation Chart

The statistical analysis conducted on geographies consisting of 234,197,392 people shows a mild positive correlation between the proportion of Sioux and percentage of population with at least nursery school education in the United States with a correlation coefficient (R) of 0.374 and weighted average of 98.6%. Similarly, the statistical analysis conducted on geographies consisting of 463,886,643 people shows a substantial positive correlation between the proportion of Immigrants from Germany and percentage of population with at least nursery school education in the United States with a correlation coefficient (R) of 0.506 and weighted average of 98.3%, a difference of 0.33%.
Sioux vs Immigrants from Germany Nursery School

Nursery School Correlation Summary

MeasurementSiouxImmigrants from Germany
Minimum96.2%98.1%
Maximum100.0%100.0%
Range3.8%1.9%
Mean99.5%99.6%
Median100.0%100.0%
Interquartile 25% (IQ1)99.2%99.1%
Interquartile 75% (IQ3)100.0%100.0%
Interquartile Range (IQR)0.77%0.90%
Standard Deviation (Sample)0.79%0.53%
Standard Deviation (Population)0.78%0.53%

Similar Demographics by Nursery School

Demographics Similar to Sioux by Nursery School

In terms of nursery school, the demographic groups most similar to Sioux are Polish (98.6%, a difference of 0.0%), Danish (98.6%, a difference of 0.0%), Scotch-Irish (98.6%, a difference of 0.0%), Arapaho (98.6%, a difference of 0.0%), and Pennsylvania German (98.6%, a difference of 0.010%).
DemographicsRating | RankNursery School
Irish
100.0
/100
|
#19
Exceptional
98.6%
Pennsylvania Germans
100.0
/100
|
#20
Exceptional
98.6%
Finns
100.0
/100
|
#21
Exceptional
98.6%
Lithuanians
100.0
/100
|
#22
Exceptional
98.6%
Poles
100.0
/100
|
#23
Exceptional
98.6%
Danes
100.0
/100
|
#24
Exceptional
98.6%
Scotch-Irish
100.0
/100
|
#25
Exceptional
98.6%
Sioux
100.0
/100
|
#26
Exceptional
98.6%
Arapaho
100.0
/100
|
#27
Exceptional
98.6%
Croatians
100.0
/100
|
#28
Exceptional
98.6%
French
100.0
/100
|
#29
Exceptional
98.6%
Europeans
100.0
/100
|
#30
Exceptional
98.6%
Czechs
100.0
/100
|
#31
Exceptional
98.6%
French Canadians
100.0
/100
|
#32
Exceptional
98.6%
Scandinavians
100.0
/100
|
#33
Exceptional
98.6%

Demographics Similar to Immigrants from Germany by Nursery School

In terms of nursery school, the demographic groups most similar to Immigrants from Germany are South African (98.3%, a difference of 0.0%), Immigrants from Western Europe (98.3%, a difference of 0.010%), Zimbabwean (98.3%, a difference of 0.010%), Macedonian (98.3%, a difference of 0.010%), and Immigrants from India (98.3%, a difference of 0.010%).
DemographicsRating | RankNursery School
Hopi
98.9
/100
|
#87
Exceptional
98.3%
Ukrainians
98.9
/100
|
#88
Exceptional
98.3%
Immigrants | South Africa
98.8
/100
|
#89
Exceptional
98.3%
Immigrants | Western Europe
98.8
/100
|
#90
Exceptional
98.3%
Zimbabweans
98.8
/100
|
#91
Exceptional
98.3%
Macedonians
98.7
/100
|
#92
Exceptional
98.3%
Immigrants | India
98.7
/100
|
#93
Exceptional
98.3%
Immigrants | Germany
98.6
/100
|
#94
Exceptional
98.3%
South Africans
98.6
/100
|
#95
Exceptional
98.3%
Cypriots
98.3
/100
|
#96
Exceptional
98.3%
Immigrants | Nonimmigrants
98.3
/100
|
#97
Exceptional
98.3%
Choctaw
98.3
/100
|
#98
Exceptional
98.3%
Colville
98.2
/100
|
#99
Exceptional
98.3%
Puget Sound Salish
98.0
/100
|
#100
Exceptional
98.3%
Romanians
97.9
/100
|
#101
Exceptional
98.3%