Sierra Leonean vs Immigrants from Thailand Kindergarten
COMPARE
Sierra Leonean
Immigrants from Thailand
Kindergarten
Kindergarten Comparison
Sierra Leoneans
Immigrants from Thailand
97.7%
KINDERGARTEN
3.4/ 100
METRIC RATING
229th/ 347
METRIC RANK
97.3%
KINDERGARTEN
0.0/ 100
METRIC RATING
288th/ 347
METRIC RANK
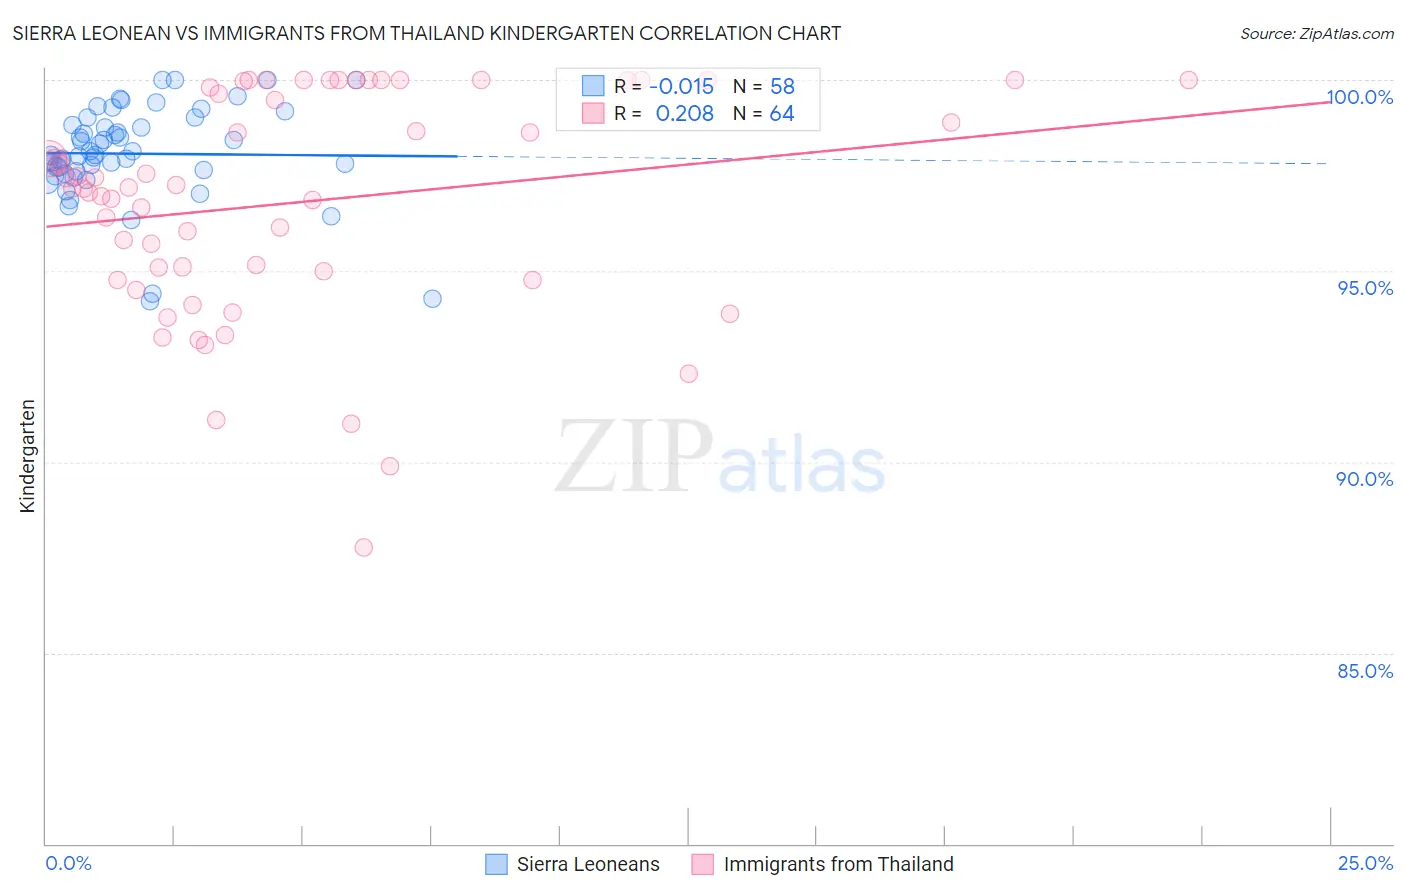
Sierra Leonean vs Immigrants from Thailand Kindergarten Correlation Chart
The statistical analysis conducted on geographies consisting of 83,337,655 people shows no correlation between the proportion of Sierra Leoneans and percentage of population with at least kindergarten education in the United States with a correlation coefficient (R) of -0.015 and weighted average of 97.7%. Similarly, the statistical analysis conducted on geographies consisting of 317,003,357 people shows a weak positive correlation between the proportion of Immigrants from Thailand and percentage of population with at least kindergarten education in the United States with a correlation coefficient (R) of 0.208 and weighted average of 97.3%, a difference of 0.40%.
Kindergarten Correlation Summary
| Measurement | Sierra Leonean | Immigrants from Thailand |
| Minimum | 94.2% | 87.7% |
| Maximum | 100.0% | 100.0% |
| Range | 5.8% | 12.3% |
| Mean | 98.1% | 96.8% |
| Median | 98.0% | 97.2% |
| Interquartile 25% (IQ1) | 97.6% | 94.9% |
| Interquartile 75% (IQ3) | 98.8% | 99.9% |
| Interquartile Range (IQR) | 1.2% | 5.0% |
| Standard Deviation (Sample) | 1.3% | 2.9% |
| Standard Deviation (Population) | 1.2% | 2.9% |
Similar Demographics by Kindergarten
Demographics Similar to Sierra Leoneans by Kindergarten
In terms of kindergarten, the demographic groups most similar to Sierra Leoneans are Subsaharan African (97.7%, a difference of 0.0%), Senegalese (97.7%, a difference of 0.0%), Iraqi (97.7%, a difference of 0.010%), Immigrants from Nepal (97.7%, a difference of 0.010%), and Sudanese (97.7%, a difference of 0.010%).
| Demographics | Rating | Rank | Kindergarten |
| Immigrants | Sudan | 4.5 /100 | #222 | Tragic 97.7% |
| Immigrants | Syria | 4.3 /100 | #223 | Tragic 97.7% |
| Iraqis | 3.9 /100 | #224 | Tragic 97.7% |
| Immigrants | Nepal | 3.8 /100 | #225 | Tragic 97.7% |
| Sudanese | 3.7 /100 | #226 | Tragic 97.7% |
| Immigrants | Costa Rica | 3.6 /100 | #227 | Tragic 97.7% |
| Sub-Saharan Africans | 3.5 /100 | #228 | Tragic 97.7% |
| Sierra Leoneans | 3.4 /100 | #229 | Tragic 97.7% |
| Senegalese | 3.3 /100 | #230 | Tragic 97.7% |
| Puerto Ricans | 2.7 /100 | #231 | Tragic 97.7% |
| Immigrants | Uruguay | 2.6 /100 | #232 | Tragic 97.7% |
| Immigrants | Pakistan | 2.2 /100 | #233 | Tragic 97.7% |
| Immigrants | Malaysia | 2.2 /100 | #234 | Tragic 97.7% |
| Colombians | 2.2 /100 | #235 | Tragic 97.7% |
| Immigrants | Western Asia | 2.1 /100 | #236 | Tragic 97.7% |
Demographics Similar to Immigrants from Thailand by Kindergarten
In terms of kindergarten, the demographic groups most similar to Immigrants from Thailand are Immigrants from Barbados (97.3%, a difference of 0.010%), Immigrants from Hong Kong (97.3%, a difference of 0.010%), Immigrants from Portugal (97.3%, a difference of 0.020%), Immigrants from Afghanistan (97.3%, a difference of 0.020%), and Immigrants from Trinidad and Tobago (97.3%, a difference of 0.030%).
| Demographics | Rating | Rank | Kindergarten |
| Trinidadians and Tobagonians | 0.1 /100 | #281 | Tragic 97.4% |
| Afghans | 0.0 /100 | #282 | Tragic 97.4% |
| Immigrants | West Indies | 0.0 /100 | #283 | Tragic 97.3% |
| Immigrants | Trinidad and Tobago | 0.0 /100 | #284 | Tragic 97.3% |
| Immigrants | Portugal | 0.0 /100 | #285 | Tragic 97.3% |
| Immigrants | Barbados | 0.0 /100 | #286 | Tragic 97.3% |
| Immigrants | Hong Kong | 0.0 /100 | #287 | Tragic 97.3% |
| Immigrants | Thailand | 0.0 /100 | #288 | Tragic 97.3% |
| Immigrants | Afghanistan | 0.0 /100 | #289 | Tragic 97.3% |
| Immigrants | St. Vincent and the Grenadines | 0.0 /100 | #290 | Tragic 97.3% |
| Houma | 0.0 /100 | #291 | Tragic 97.3% |
| British West Indians | 0.0 /100 | #292 | Tragic 97.3% |
| Malaysians | 0.0 /100 | #293 | Tragic 97.2% |
| Immigrants | Immigrants | 0.0 /100 | #294 | Tragic 97.2% |
| Immigrants | Grenada | 0.0 /100 | #295 | Tragic 97.2% |