Sierra Leonean vs Immigrants from Poland 10th Grade

COMPARE

Sierra Leonean
Race
Ancestry
AfghanAfricanAlaska NativeAlaskan AthabascanAlbanianAleutAlsatianAmericanApacheArabArapahoArgentineanArmenianAssyrian/Chaldean/SyriacAustralianAustrianBahamianBangladeshiBarbadianBasqueBelgianBelizeanBermudanBhutaneseBlackfeetBolivianBrazilianBritishBritish West IndianBulgarianBurmeseCajunCambodianCanadianCape VerdeanCarpatho RusynCelticCentral AmericanCentral American IndianCherokeeCheyenneChickasawChileanChineseChippewaChoctawColombianColvilleComancheCosta RicanCreeCreekCroatianCrowCubanCypriotCzechCzechoslovakianDanishDelawareDominicanDutchDutch West IndianEastern EuropeanEcuadorianEgyptianEnglishEstonianEthiopianEuropeanFijianFilipinoFinnishFrenchFrench American IndianFrench CanadianGermanGerman RussianGhanaianGreekGuamanian/ChamorroGuatemalanGuyaneseHaitianHmongHonduranHopiHoumaHungarianIcelanderIndian (Asian)IndonesianInupiatIranianIraqiIrishIroquoisIsraeliItalianJamaicanJapaneseJordanianKenyanKiowaKoreanLaotianLatvianLebaneseLiberianLithuanianLumbeeLuxembourgerMacedonianMalaysianMalteseMarshalleseMenomineeMexicanMexican American IndianMongolianMoroccanNative HawaiianNavajoNepaleseNew ZealanderNicaraguanNigerianNorthern EuropeanNorwegianOkinawanOsageOttawaPaiutePakistaniPalestinianPanamanianParaguayanPennsylvania GermanPeruvianPimaPolishPortuguesePotawatomiPuebloPuerto RicanPuget Sound SalishRomanianRussianSalvadoranSamoanScandinavianScotch-IrishScottishSeminoleSenegaleseSerbianShoshoneSierra LeoneanSiouxSlavicSlovakSloveneSomaliSouth AfricanSouth AmericanSouth American IndianSoviet UnionSpaniardSpanishSpanish AmericanSpanish American IndianSri LankanSubsaharan AfricanSudaneseSwedishSwissSyrianTaiwaneseThaiTlingit-HaidaTohono O'OdhamTonganTrinidadian and TobagonianTsimshianTurkishU.S. Virgin IslanderUgandanUkrainianUruguayanUteVenezuelanVietnameseWelshWest IndianYakamaYaquiYugoslavianYumanYup'ikZimbabwean
Immigration
NonimmigrantsImmigrantsAfghanistanAfricaAlbaniaArgentinaArmeniaAsiaAustraliaAustriaBahamasBangladeshBarbadosBelarusBelgiumBelizeBoliviaBosnia and HerzegovinaBrazilBulgariaBurma/MyanmarCabo VerdeCambodiaCameroonCanadaCaribbeanCentral AmericaChileChinaColombiaCongoCosta RicaCroatiaCubaCzechoslovakiaDenmarkDominicaDominican RepublicEastern AfricaEastern AsiaEastern EuropeEcuadorEgyptEl SalvadorEnglandEritreaEthiopiaEuropeFijiFranceGermanyGhanaGreeceGrenadaGuatemalaGuyanaHaitiHondurasHong KongHungaryIndiaIndonesiaIranIraqIrelandIsraelItalyJamaicaJapanJordanKazakhstanKenyaKoreaKuwaitLaosLatin AmericaLatviaLebanonLiberiaLithuaniaMalaysiaMexicoMicronesiaMiddle AfricaMoldovaMoroccoNepalNetherlandsNicaraguaNigeriaNorth AmericaNorth MacedoniaNorthern AfricaNorthern EuropeNorwayOceaniaPakistanPanamaPeruPhilippinesPortugalRomaniaRussiaSaudi ArabiaScotlandSenegalSerbiaSierra LeoneSingaporeSomaliaSouth AfricaSouth AmericaSouth Central AsiaSouth Eastern AsiaSouthern EuropeSpainSri LankaSt. Vincent and the GrenadinesSudanSwedenSwitzerlandSyriaTaiwanThailandTrinidad and TobagoTurkeyUgandaUkraineUruguayUzbekistanVenezuelaVietnamWest IndiesWestern AfricaWestern AsiaWestern EuropeYemenZaireZimbabweAzores
Immigrants from Poland
Race
Ancestry
AfghanAfricanAlaska NativeAlaskan AthabascanAlbanianAleutAlsatianAmericanApacheArabArapahoArgentineanArmenianAssyrian/Chaldean/SyriacAustralianAustrianBahamianBangladeshiBarbadianBasqueBelgianBelizeanBermudanBhutaneseBlackfeetBolivianBrazilianBritishBritish West IndianBulgarianBurmeseCajunCambodianCanadianCape VerdeanCarpatho RusynCelticCentral AmericanCentral American IndianCherokeeCheyenneChickasawChileanChineseChippewaChoctawColombianColvilleComancheCosta RicanCreeCreekCroatianCrowCubanCypriotCzechCzechoslovakianDanishDelawareDominicanDutchDutch West IndianEastern EuropeanEcuadorianEgyptianEnglishEstonianEthiopianEuropeanFijianFilipinoFinnishFrenchFrench American IndianFrench CanadianGermanGerman RussianGhanaianGreekGuamanian/ChamorroGuatemalanGuyaneseHaitianHmongHonduranHopiHoumaHungarianIcelanderIndian (Asian)IndonesianInupiatIranianIraqiIrishIroquoisIsraeliItalianJamaicanJapaneseJordanianKenyanKiowaKoreanLaotianLatvianLebaneseLiberianLithuanianLumbeeLuxembourgerMacedonianMalaysianMalteseMarshalleseMenomineeMexicanMexican American IndianMongolianMoroccanNative HawaiianNavajoNepaleseNew ZealanderNicaraguanNigerianNorthern EuropeanNorwegianOkinawanOsageOttawaPaiutePakistaniPalestinianPanamanianParaguayanPennsylvania GermanPeruvianPimaPolishPortuguesePotawatomiPuebloPuerto RicanPuget Sound SalishRomanianRussianSalvadoranSamoanScandinavianScotch-IrishScottishSeminoleSenegaleseSerbianShoshoneSiouxSlavicSlovakSloveneSomaliSouth AfricanSouth AmericanSouth American IndianSoviet UnionSpaniardSpanishSpanish AmericanSpanish American IndianSri LankanSubsaharan AfricanSudaneseSwedishSwissSyrianTaiwaneseThaiTlingit-HaidaTohono O'OdhamTonganTrinidadian and TobagonianTsimshianTurkishU.S. Virgin IslanderUgandanUkrainianUruguayanUteVenezuelanVietnameseWelshWest IndianYakamaYaquiYugoslavianYumanYup'ikZimbabwean
Immigration
NonimmigrantsImmigrantsAfghanistanAfricaAlbaniaArgentinaArmeniaAsiaAustraliaAustriaBahamasBangladeshBarbadosBelarusBelgiumBelizeBoliviaBosnia and HerzegovinaBrazilBulgariaBurma/MyanmarCabo VerdeCambodiaCameroonCanadaCaribbeanCentral AmericaChileChinaColombiaCongoCosta RicaCroatiaCubaCzechoslovakiaDenmarkDominicaDominican RepublicEastern AfricaEastern AsiaEastern EuropeEcuadorEgyptEl SalvadorEnglandEritreaEthiopiaEuropeFijiFranceGermanyGhanaGreeceGrenadaGuatemalaGuyanaHaitiHondurasHong KongHungaryIndiaIndonesiaIranIraqIrelandIsraelItalyJamaicaJapanJordanKazakhstanKenyaKoreaKuwaitLaosLatin AmericaLatviaLebanonLiberiaLithuaniaMalaysiaMexicoMicronesiaMiddle AfricaMoldovaMoroccoNepalNetherlandsNicaraguaNigeriaNorth AmericaNorth MacedoniaNorthern AfricaNorthern EuropeNorwayOceaniaPakistanPanamaPeruPhilippinesPolandPortugalRomaniaRussiaSaudi ArabiaScotlandSenegalSerbiaSierra LeoneSingaporeSomaliaSouth AfricaSouth AmericaSouth Central AsiaSouth Eastern AsiaSouthern EuropeSpainSri LankaSt. Vincent and the GrenadinesSudanSwedenSwitzerlandSyriaTaiwanThailandTrinidad and TobagoTurkeyUgandaUkraineUruguayUzbekistanVenezuelaVietnamWest IndiesWestern AfricaWestern AsiaWestern EuropeYemenZaireZimbabweAzores
10th Grade
Income
Poverty
Unemployment
Labor Participation
Family Structure
Vehicle Availability
Education Level
Disability

10th Grade Comparison

Sierra Leoneans

Immigrants from Poland

Average
Good
93.7%
10TH GRADE
46.1/ 100
METRIC RATING
178th/ 347
METRIC RANK
93.9%
10TH GRADE
69.6/ 100
METRIC RATING
162nd/ 347
METRIC RANK

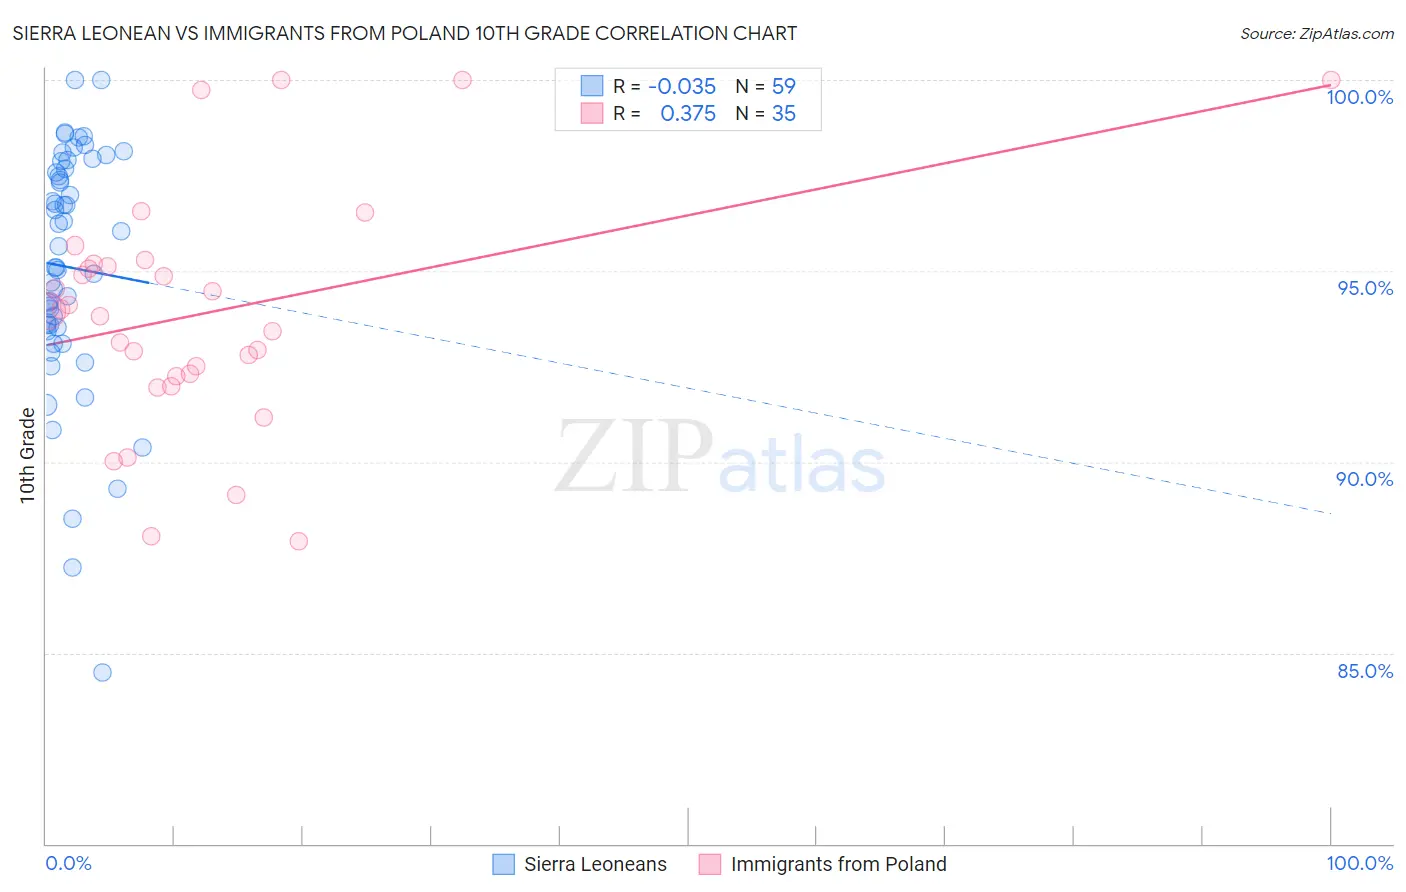
Sierra Leonean vs Immigrants from Poland 10th Grade Correlation Chart

The statistical analysis conducted on geographies consisting of 83,357,120 people shows no correlation between the proportion of Sierra Leoneans and percentage of population with at least 10th grade education in the United States with a correlation coefficient (R) of -0.035 and weighted average of 93.7%. Similarly, the statistical analysis conducted on geographies consisting of 304,861,877 people shows a mild positive correlation between the proportion of Immigrants from Poland and percentage of population with at least 10th grade education in the United States with a correlation coefficient (R) of 0.375 and weighted average of 93.9%, a difference of 0.22%.
Sierra Leonean vs Immigrants from Poland 10th Grade

10th Grade Correlation Summary

MeasurementSierra LeoneanImmigrants from Poland
Minimum84.5%87.9%
Maximum100.0%100.0%
Range15.5%12.1%
Mean95.1%93.9%
Median95.1%94.0%
Interquartile 25% (IQ1)93.5%92.3%
Interquartile 75% (IQ3)97.7%95.2%
Interquartile Range (IQR)4.2%2.9%
Standard Deviation (Sample)3.2%3.1%
Standard Deviation (Population)3.1%3.0%

Demographics Similar to Sierra Leoneans and Immigrants from Poland by 10th Grade

In terms of 10th grade, the demographic groups most similar to Sierra Leoneans are Immigrants from Argentina (93.7%, a difference of 0.010%), Immigrants from Lebanon (93.7%, a difference of 0.010%), Paraguayan (93.7%, a difference of 0.010%), Argentinean (93.7%, a difference of 0.030%), and Immigrants from Nepal (93.7%, a difference of 0.030%). Similarly, the demographic groups most similar to Immigrants from Poland are Assyrian/Chaldean/Syriac (93.9%, a difference of 0.0%), Venezuelan (93.9%, a difference of 0.0%), Pakistani (93.9%, a difference of 0.010%), Iraqi (93.9%, a difference of 0.020%), and Brazilian (93.8%, a difference of 0.060%).
DemographicsRating | Rank10th Grade
Pakistanis
70.1
/100
|
#160
Good
93.9%
Assyrians/Chaldeans/Syriacs
69.7
/100
|
#161
Good
93.9%
Immigrants | Poland
69.6
/100
|
#162
Good
93.9%
Venezuelans
69.5
/100
|
#163
Good
93.9%
Iraqis
68.1
/100
|
#164
Good
93.9%
Brazilians
63.6
/100
|
#165
Good
93.8%
Immigrants | Iraq
63.0
/100
|
#166
Good
93.8%
Immigrants | Egypt
62.3
/100
|
#167
Good
93.8%
Alsatians
59.4
/100
|
#168
Average
93.8%
Immigrants | Spain
55.9
/100
|
#169
Average
93.8%
Immigrants | Venezuela
53.9
/100
|
#170
Average
93.8%
Immigrants | Albania
52.4
/100
|
#171
Average
93.8%
French American Indians
50.9
/100
|
#172
Average
93.7%
Spaniards
50.3
/100
|
#173
Average
93.7%
Argentineans
50.0
/100
|
#174
Average
93.7%
Immigrants | Nepal
49.6
/100
|
#175
Average
93.7%
Immigrants | Argentina
47.1
/100
|
#176
Average
93.7%
Immigrants | Lebanon
47.1
/100
|
#177
Average
93.7%
Sierra Leoneans
46.1
/100
|
#178
Average
93.7%
Paraguayans
45.3
/100
|
#179
Average
93.7%
Blackfeet
42.8
/100
|
#180
Average
93.7%