Scottish vs Immigrants from Northern Africa 10th Grade

COMPARE

Scottish
Race
Ancestry
AfghanAfricanAlaska NativeAlaskan AthabascanAlbanianAleutAlsatianAmericanApacheArabArapahoArgentineanArmenianAssyrian/Chaldean/SyriacAustralianAustrianBahamianBangladeshiBarbadianBasqueBelgianBelizeanBermudanBhutaneseBlackfeetBolivianBrazilianBritishBritish West IndianBulgarianBurmeseCajunCambodianCanadianCape VerdeanCarpatho RusynCelticCentral AmericanCentral American IndianCherokeeCheyenneChickasawChileanChineseChippewaChoctawColombianColvilleComancheCosta RicanCreeCreekCroatianCrowCubanCypriotCzechCzechoslovakianDanishDelawareDominicanDutchDutch West IndianEastern EuropeanEcuadorianEgyptianEnglishEstonianEthiopianEuropeanFijianFilipinoFinnishFrenchFrench American IndianFrench CanadianGermanGerman RussianGhanaianGreekGuamanian/ChamorroGuatemalanGuyaneseHaitianHmongHonduranHopiHoumaHungarianIcelanderIndian (Asian)IndonesianInupiatIranianIraqiIrishIroquoisIsraeliItalianJamaicanJapaneseJordanianKenyanKiowaKoreanLaotianLatvianLebaneseLiberianLithuanianLumbeeLuxembourgerMacedonianMalaysianMalteseMarshalleseMenomineeMexicanMexican American IndianMongolianMoroccanNative HawaiianNavajoNepaleseNew ZealanderNicaraguanNigerianNorthern EuropeanNorwegianOkinawanOsageOttawaPaiutePakistaniPalestinianPanamanianParaguayanPennsylvania GermanPeruvianPimaPolishPortuguesePotawatomiPuebloPuerto RicanPuget Sound SalishRomanianRussianSalvadoranSamoanScandinavianScotch-IrishScottishSeminoleSenegaleseSerbianShoshoneSierra LeoneanSiouxSlavicSlovakSloveneSomaliSouth AfricanSouth AmericanSouth American IndianSoviet UnionSpaniardSpanishSpanish AmericanSpanish American IndianSri LankanSubsaharan AfricanSudaneseSwedishSwissSyrianTaiwaneseThaiTlingit-HaidaTohono O'OdhamTonganTrinidadian and TobagonianTsimshianTurkishU.S. Virgin IslanderUgandanUkrainianUruguayanUteVenezuelanVietnameseWelshWest IndianYakamaYaquiYugoslavianYumanYup'ikZimbabwean
Immigration
NonimmigrantsImmigrantsAfghanistanAfricaAlbaniaArgentinaArmeniaAsiaAustraliaAustriaBahamasBangladeshBarbadosBelarusBelgiumBelizeBoliviaBosnia and HerzegovinaBrazilBulgariaBurma/MyanmarCabo VerdeCambodiaCameroonCanadaCaribbeanCentral AmericaChileChinaColombiaCongoCosta RicaCroatiaCubaCzechoslovakiaDenmarkDominicaDominican RepublicEastern AfricaEastern AsiaEastern EuropeEcuadorEgyptEl SalvadorEnglandEritreaEthiopiaEuropeFijiFranceGermanyGhanaGreeceGrenadaGuatemalaGuyanaHaitiHondurasHong KongHungaryIndiaIndonesiaIranIraqIrelandIsraelItalyJamaicaJapanJordanKazakhstanKenyaKoreaKuwaitLaosLatin AmericaLatviaLebanonLiberiaLithuaniaMalaysiaMexicoMicronesiaMiddle AfricaMoldovaMoroccoNepalNetherlandsNicaraguaNigeriaNorth AmericaNorth MacedoniaNorthern EuropeNorwayOceaniaPakistanPanamaPeruPhilippinesPolandPortugalRomaniaRussiaSaudi ArabiaScotlandSenegalSerbiaSierra LeoneSingaporeSomaliaSouth AfricaSouth AmericaSouth Central AsiaSouth Eastern AsiaSouthern EuropeSpainSri LankaSt. Vincent and the GrenadinesSudanSwedenSwitzerlandSyriaTaiwanThailandTrinidad and TobagoTurkeyUgandaUkraineUruguayUzbekistanVenezuelaVietnamWest IndiesWestern AfricaWestern AsiaWestern EuropeYemenZaireZimbabweAzores
Immigrants from Northern Africa
Race
Ancestry
AfghanAfricanAlaska NativeAlaskan AthabascanAlbanianAleutAlsatianAmericanApacheArabArapahoArgentineanArmenianAssyrian/Chaldean/SyriacAustralianAustrianBahamianBangladeshiBarbadianBasqueBelgianBelizeanBermudanBhutaneseBlackfeetBolivianBrazilianBritishBritish West IndianBulgarianBurmeseCajunCambodianCanadianCape VerdeanCarpatho RusynCelticCentral AmericanCentral American IndianCherokeeCheyenneChickasawChileanChineseChippewaChoctawColombianColvilleComancheCosta RicanCreeCreekCroatianCrowCubanCypriotCzechCzechoslovakianDanishDelawareDominicanDutchDutch West IndianEastern EuropeanEcuadorianEgyptianEnglishEstonianEthiopianEuropeanFijianFilipinoFinnishFrenchFrench American IndianFrench CanadianGermanGerman RussianGhanaianGreekGuamanian/ChamorroGuatemalanGuyaneseHaitianHmongHonduranHopiHoumaHungarianIcelanderIndian (Asian)IndonesianInupiatIranianIraqiIrishIroquoisIsraeliItalianJamaicanJapaneseJordanianKenyanKiowaKoreanLaotianLatvianLebaneseLiberianLithuanianLumbeeLuxembourgerMacedonianMalaysianMalteseMarshalleseMenomineeMexicanMexican American IndianMongolianMoroccanNative HawaiianNavajoNepaleseNew ZealanderNicaraguanNigerianNorthern EuropeanNorwegianOkinawanOsageOttawaPaiutePakistaniPalestinianPanamanianParaguayanPennsylvania GermanPeruvianPimaPolishPortuguesePotawatomiPuebloPuerto RicanPuget Sound SalishRomanianRussianSalvadoranSamoanScandinavianScotch-IrishSeminoleSenegaleseSerbianShoshoneSierra LeoneanSiouxSlavicSlovakSloveneSomaliSouth AfricanSouth AmericanSouth American IndianSoviet UnionSpaniardSpanishSpanish AmericanSpanish American IndianSri LankanSubsaharan AfricanSudaneseSwedishSwissSyrianTaiwaneseThaiTlingit-HaidaTohono O'OdhamTonganTrinidadian and TobagonianTsimshianTurkishU.S. Virgin IslanderUgandanUkrainianUruguayanUteVenezuelanVietnameseWelshWest IndianYakamaYaquiYugoslavianYumanYup'ikZimbabwean
Immigration
NonimmigrantsImmigrantsAfghanistanAfricaAlbaniaArgentinaArmeniaAsiaAustraliaAustriaBahamasBangladeshBarbadosBelarusBelgiumBelizeBoliviaBosnia and HerzegovinaBrazilBulgariaBurma/MyanmarCabo VerdeCambodiaCameroonCanadaCaribbeanCentral AmericaChileChinaColombiaCongoCosta RicaCroatiaCubaCzechoslovakiaDenmarkDominicaDominican RepublicEastern AfricaEastern AsiaEastern EuropeEcuadorEgyptEl SalvadorEnglandEritreaEthiopiaEuropeFijiFranceGermanyGhanaGreeceGrenadaGuatemalaGuyanaHaitiHondurasHong KongHungaryIndiaIndonesiaIranIraqIrelandIsraelItalyJamaicaJapanJordanKazakhstanKenyaKoreaKuwaitLaosLatin AmericaLatviaLebanonLiberiaLithuaniaMalaysiaMexicoMicronesiaMiddle AfricaMoldovaMoroccoNepalNetherlandsNicaraguaNigeriaNorth AmericaNorth MacedoniaNorthern AfricaNorthern EuropeNorwayOceaniaPakistanPanamaPeruPhilippinesPolandPortugalRomaniaRussiaSaudi ArabiaScotlandSenegalSerbiaSierra LeoneSingaporeSomaliaSouth AfricaSouth AmericaSouth Central AsiaSouth Eastern AsiaSouthern EuropeSpainSri LankaSt. Vincent and the GrenadinesSudanSwedenSwitzerlandSyriaTaiwanThailandTrinidad and TobagoTurkeyUgandaUkraineUruguayUzbekistanVenezuelaVietnamWest IndiesWestern AfricaWestern AsiaWestern EuropeYemenZaireZimbabweAzores
10th Grade
Income
Poverty
Unemployment
Labor Participation
Family Structure
Vehicle Availability
Education Level
Disability

10th Grade Comparison

Scottish

Immigrants from Northern Africa

Exceptional
Average
95.6%
10TH GRADE
100.0/ 100
METRIC RATING
16th/ 347
METRIC RANK
93.7%
10TH GRADE
41.6/ 100
METRIC RATING
181st/ 347
METRIC RANK

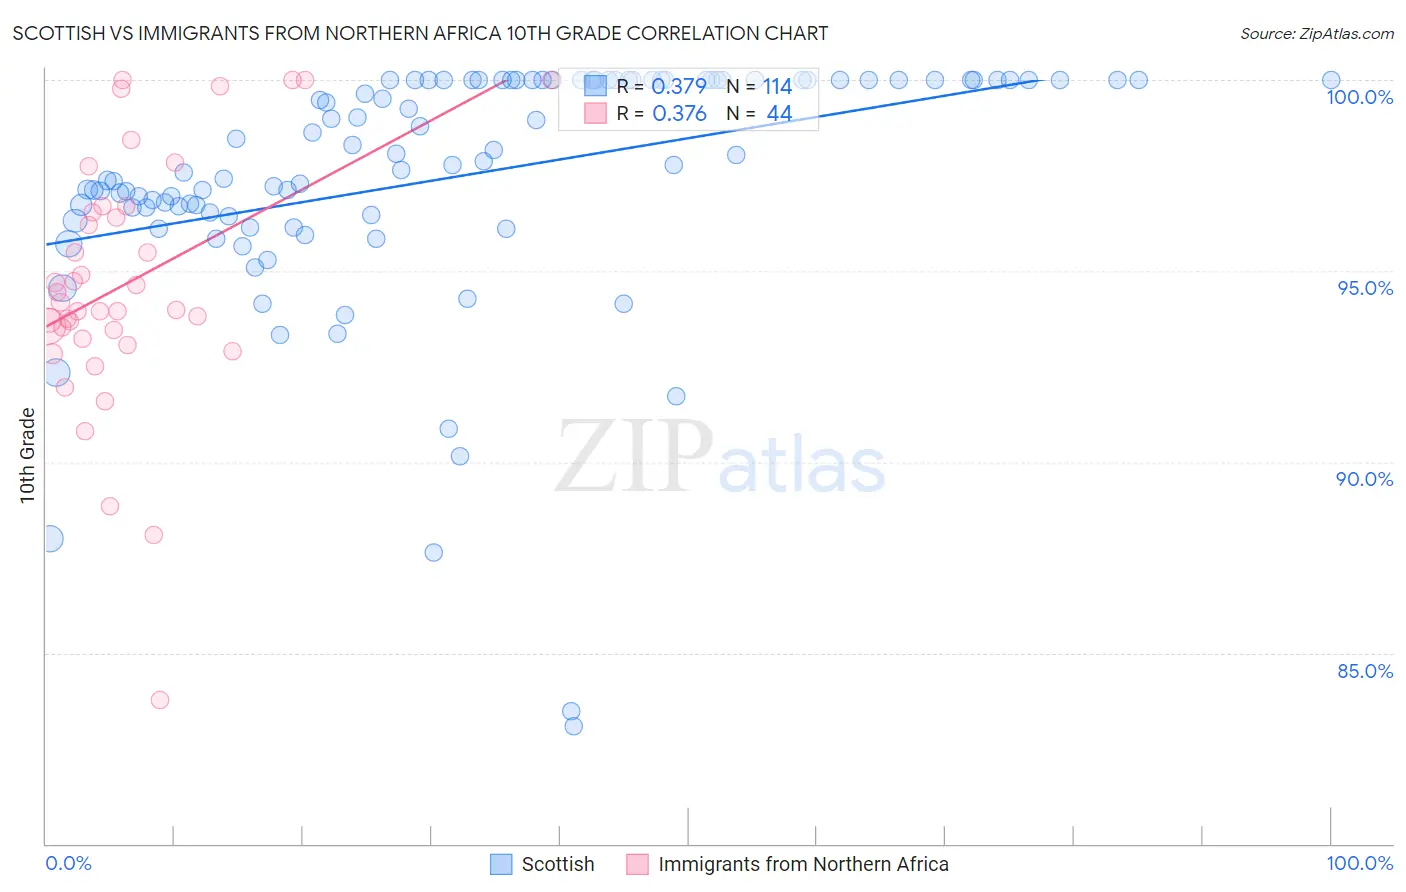
Scottish vs Immigrants from Northern Africa 10th Grade Correlation Chart

The statistical analysis conducted on geographies consisting of 567,140,525 people shows a mild positive correlation between the proportion of Scottish and percentage of population with at least 10th grade education in the United States with a correlation coefficient (R) of 0.379 and weighted average of 95.6%. Similarly, the statistical analysis conducted on geographies consisting of 321,196,768 people shows a mild positive correlation between the proportion of Immigrants from Northern Africa and percentage of population with at least 10th grade education in the United States with a correlation coefficient (R) of 0.376 and weighted average of 93.7%, a difference of 2.1%.
Scottish vs Immigrants from Northern Africa 10th Grade

10th Grade Correlation Summary

MeasurementScottishImmigrants from Northern Africa
Minimum83.1%83.8%
Maximum100.0%100.0%
Range16.9%16.2%
Mean97.5%94.7%
Median97.9%94.1%
Interquartile 25% (IQ1)96.5%93.3%
Interquartile 75% (IQ3)100.0%96.6%
Interquartile Range (IQR)3.5%3.3%
Standard Deviation (Sample)3.2%3.3%
Standard Deviation (Population)3.2%3.3%

Similar Demographics by 10th Grade

Demographics Similar to Scottish by 10th Grade

In terms of 10th grade, the demographic groups most similar to Scottish are Irish (95.6%, a difference of 0.010%), Latvian (95.6%, a difference of 0.010%), Italian (95.6%, a difference of 0.020%), Scandinavian (95.6%, a difference of 0.020%), and Tsimshian (95.6%, a difference of 0.030%).
DemographicsRating | Rank10th Grade
Finns
100.0
/100
|
#9
Exceptional
95.8%
Croatians
100.0
/100
|
#10
Exceptional
95.7%
Danes
100.0
/100
|
#11
Exceptional
95.7%
Tlingit-Haida
100.0
/100
|
#12
Exceptional
95.7%
English
100.0
/100
|
#13
Exceptional
95.6%
Tsimshian
100.0
/100
|
#14
Exceptional
95.6%
Irish
100.0
/100
|
#15
Exceptional
95.6%
Scottish
100.0
/100
|
#16
Exceptional
95.6%
Latvians
100.0
/100
|
#17
Exceptional
95.6%
Italians
100.0
/100
|
#18
Exceptional
95.6%
Scandinavians
100.0
/100
|
#19
Exceptional
95.6%
Chinese
100.0
/100
|
#20
Exceptional
95.5%
Dutch
100.0
/100
|
#21
Exceptional
95.5%
Eastern Europeans
100.0
/100
|
#22
Exceptional
95.5%
Czechs
100.0
/100
|
#23
Exceptional
95.5%

Demographics Similar to Immigrants from Northern Africa by 10th Grade

In terms of 10th grade, the demographic groups most similar to Immigrants from Northern Africa are Blackfeet (93.7%, a difference of 0.010%), Paraguayan (93.7%, a difference of 0.030%), Colville (93.6%, a difference of 0.030%), Sierra Leonean (93.7%, a difference of 0.040%), and Guamanian/Chamorro (93.6%, a difference of 0.040%).
DemographicsRating | Rank10th Grade
Argentineans
50.0
/100
|
#174
Average
93.7%
Immigrants | Nepal
49.6
/100
|
#175
Average
93.7%
Immigrants | Argentina
47.1
/100
|
#176
Average
93.7%
Immigrants | Lebanon
47.1
/100
|
#177
Average
93.7%
Sierra Leoneans
46.1
/100
|
#178
Average
93.7%
Paraguayans
45.3
/100
|
#179
Average
93.7%
Blackfeet
42.8
/100
|
#180
Average
93.7%
Immigrants | Northern Africa
41.6
/100
|
#181
Average
93.7%
Colville
38.8
/100
|
#182
Fair
93.6%
Guamanians/Chamorros
37.1
/100
|
#183
Fair
93.6%
Choctaw
36.6
/100
|
#184
Fair
93.6%
Sudanese
36.6
/100
|
#185
Fair
93.6%
Immigrants | Eastern Asia
35.1
/100
|
#186
Fair
93.6%
Liberians
34.7
/100
|
#187
Fair
93.6%
Marshallese
33.2
/100
|
#188
Fair
93.6%