Scottish vs Immigrants from Ghana 4th Grade

COMPARE

Scottish
Race
Ancestry
AfghanAfricanAlaska NativeAlaskan AthabascanAlbanianAleutAlsatianAmericanApacheArabArapahoArgentineanArmenianAssyrian/Chaldean/SyriacAustralianAustrianBahamianBangladeshiBarbadianBasqueBelgianBelizeanBermudanBhutaneseBlackfeetBolivianBrazilianBritishBritish West IndianBulgarianBurmeseCajunCambodianCanadianCape VerdeanCarpatho RusynCelticCentral AmericanCentral American IndianCherokeeCheyenneChickasawChileanChineseChippewaChoctawColombianColvilleComancheCosta RicanCreeCreekCroatianCrowCubanCypriotCzechCzechoslovakianDanishDelawareDominicanDutchDutch West IndianEastern EuropeanEcuadorianEgyptianEnglishEstonianEthiopianEuropeanFijianFilipinoFinnishFrenchFrench American IndianFrench CanadianGermanGerman RussianGhanaianGreekGuamanian/ChamorroGuatemalanGuyaneseHaitianHmongHonduranHopiHoumaHungarianIcelanderIndian (Asian)IndonesianInupiatIranianIraqiIrishIroquoisIsraeliItalianJamaicanJapaneseJordanianKenyanKiowaKoreanLaotianLatvianLebaneseLiberianLithuanianLumbeeLuxembourgerMacedonianMalaysianMalteseMarshalleseMenomineeMexicanMexican American IndianMongolianMoroccanNative HawaiianNavajoNepaleseNew ZealanderNicaraguanNigerianNorthern EuropeanNorwegianOkinawanOsageOttawaPaiutePakistaniPalestinianPanamanianParaguayanPennsylvania GermanPeruvianPimaPolishPortuguesePotawatomiPuebloPuerto RicanPuget Sound SalishRomanianRussianSalvadoranSamoanScandinavianScotch-IrishScottishSeminoleSenegaleseSerbianShoshoneSierra LeoneanSiouxSlavicSlovakSloveneSomaliSouth AfricanSouth AmericanSouth American IndianSoviet UnionSpaniardSpanishSpanish AmericanSpanish American IndianSri LankanSubsaharan AfricanSudaneseSwedishSwissSyrianTaiwaneseThaiTlingit-HaidaTohono O'OdhamTonganTrinidadian and TobagonianTsimshianTurkishU.S. Virgin IslanderUgandanUkrainianUruguayanUteVenezuelanVietnameseWelshWest IndianYakamaYaquiYugoslavianYumanYup'ikZimbabwean
Immigration
NonimmigrantsImmigrantsAfghanistanAfricaAlbaniaArgentinaArmeniaAsiaAustraliaAustriaBahamasBangladeshBarbadosBelarusBelgiumBelizeBoliviaBosnia and HerzegovinaBrazilBulgariaBurma/MyanmarCabo VerdeCambodiaCameroonCanadaCaribbeanCentral AmericaChileChinaColombiaCongoCosta RicaCroatiaCubaCzechoslovakiaDenmarkDominicaDominican RepublicEastern AfricaEastern AsiaEastern EuropeEcuadorEgyptEl SalvadorEnglandEritreaEthiopiaEuropeFijiFranceGermanyGreeceGrenadaGuatemalaGuyanaHaitiHondurasHong KongHungaryIndiaIndonesiaIranIraqIrelandIsraelItalyJamaicaJapanJordanKazakhstanKenyaKoreaKuwaitLaosLatin AmericaLatviaLebanonLiberiaLithuaniaMalaysiaMexicoMicronesiaMiddle AfricaMoldovaMoroccoNepalNetherlandsNicaraguaNigeriaNorth AmericaNorth MacedoniaNorthern AfricaNorthern EuropeNorwayOceaniaPakistanPanamaPeruPhilippinesPolandPortugalRomaniaRussiaSaudi ArabiaScotlandSenegalSerbiaSierra LeoneSingaporeSomaliaSouth AfricaSouth AmericaSouth Central AsiaSouth Eastern AsiaSouthern EuropeSpainSri LankaSt. Vincent and the GrenadinesSudanSwedenSwitzerlandSyriaTaiwanThailandTrinidad and TobagoTurkeyUgandaUkraineUruguayUzbekistanVenezuelaVietnamWest IndiesWestern AfricaWestern AsiaWestern EuropeYemenZaireZimbabweAzores
Immigrants from Ghana
Race
Ancestry
AfghanAfricanAlaska NativeAlaskan AthabascanAlbanianAleutAlsatianAmericanApacheArabArapahoArgentineanArmenianAssyrian/Chaldean/SyriacAustralianAustrianBahamianBangladeshiBarbadianBasqueBelgianBelizeanBermudanBhutaneseBlackfeetBolivianBrazilianBritishBritish West IndianBulgarianBurmeseCajunCambodianCanadianCape VerdeanCarpatho RusynCelticCentral AmericanCentral American IndianCherokeeCheyenneChickasawChileanChineseChippewaChoctawColombianColvilleComancheCosta RicanCreeCreekCroatianCrowCubanCypriotCzechCzechoslovakianDanishDelawareDominicanDutchDutch West IndianEastern EuropeanEcuadorianEgyptianEnglishEstonianEthiopianEuropeanFijianFilipinoFinnishFrenchFrench American IndianFrench CanadianGermanGerman RussianGhanaianGreekGuamanian/ChamorroGuatemalanGuyaneseHaitianHmongHonduranHopiHoumaHungarianIcelanderIndian (Asian)IndonesianInupiatIranianIraqiIrishIroquoisIsraeliItalianJamaicanJapaneseJordanianKenyanKiowaKoreanLaotianLatvianLebaneseLiberianLithuanianLumbeeLuxembourgerMacedonianMalaysianMalteseMarshalleseMenomineeMexicanMexican American IndianMongolianMoroccanNative HawaiianNavajoNepaleseNew ZealanderNicaraguanNigerianNorthern EuropeanNorwegianOkinawanOsageOttawaPaiutePakistaniPalestinianPanamanianParaguayanPennsylvania GermanPeruvianPimaPolishPortuguesePotawatomiPuebloPuerto RicanPuget Sound SalishRomanianRussianSalvadoranSamoanScandinavianScotch-IrishSeminoleSenegaleseSerbianShoshoneSierra LeoneanSiouxSlavicSlovakSloveneSomaliSouth AfricanSouth AmericanSouth American IndianSoviet UnionSpaniardSpanishSpanish AmericanSpanish American IndianSri LankanSubsaharan AfricanSudaneseSwedishSwissSyrianTaiwaneseThaiTlingit-HaidaTohono O'OdhamTonganTrinidadian and TobagonianTsimshianTurkishU.S. Virgin IslanderUgandanUkrainianUruguayanUteVenezuelanVietnameseWelshWest IndianYakamaYaquiYugoslavianYumanYup'ikZimbabwean
Immigration
NonimmigrantsImmigrantsAfghanistanAfricaAlbaniaArgentinaArmeniaAsiaAustraliaAustriaBahamasBangladeshBarbadosBelarusBelgiumBelizeBoliviaBosnia and HerzegovinaBrazilBulgariaBurma/MyanmarCabo VerdeCambodiaCameroonCanadaCaribbeanCentral AmericaChileChinaColombiaCongoCosta RicaCroatiaCubaCzechoslovakiaDenmarkDominicaDominican RepublicEastern AfricaEastern AsiaEastern EuropeEcuadorEgyptEl SalvadorEnglandEritreaEthiopiaEuropeFijiFranceGermanyGhanaGreeceGrenadaGuatemalaGuyanaHaitiHondurasHong KongHungaryIndiaIndonesiaIranIraqIrelandIsraelItalyJamaicaJapanJordanKazakhstanKenyaKoreaKuwaitLaosLatin AmericaLatviaLebanonLiberiaLithuaniaMalaysiaMexicoMicronesiaMiddle AfricaMoldovaMoroccoNepalNetherlandsNicaraguaNigeriaNorth AmericaNorth MacedoniaNorthern AfricaNorthern EuropeNorwayOceaniaPakistanPanamaPeruPhilippinesPolandPortugalRomaniaRussiaSaudi ArabiaScotlandSenegalSerbiaSierra LeoneSingaporeSomaliaSouth AfricaSouth AmericaSouth Central AsiaSouth Eastern AsiaSouthern EuropeSpainSri LankaSt. Vincent and the GrenadinesSudanSwedenSwitzerlandSyriaTaiwanThailandTrinidad and TobagoTurkeyUgandaUkraineUruguayUzbekistanVenezuelaVietnamWest IndiesWestern AfricaWestern AsiaWestern EuropeYemenZaireZimbabweAzores
4th Grade
Income
Poverty
Unemployment
Labor Participation
Family Structure
Vehicle Availability
Education Level
Disability

4th Grade Comparison

Scottish

Immigrants from Ghana

Exceptional
Tragic
98.4%
4TH GRADE
100.0/ 100
METRIC RATING
16th/ 347
METRIC RANK
96.9%
4TH GRADE
0.1/ 100
METRIC RATING
275th/ 347
METRIC RANK

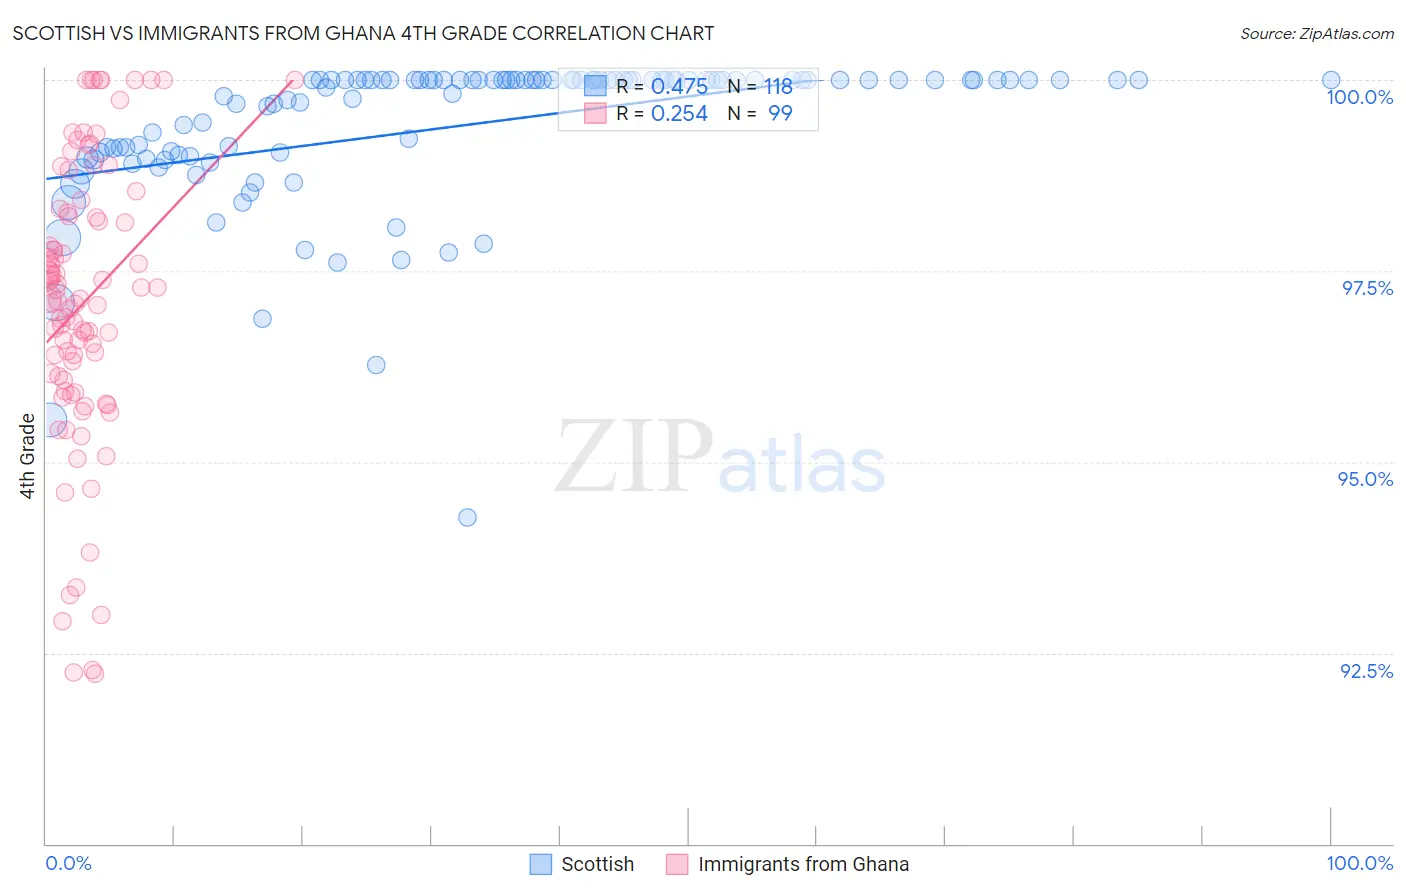
Scottish vs Immigrants from Ghana 4th Grade Correlation Chart

The statistical analysis conducted on geographies consisting of 567,141,733 people shows a moderate positive correlation between the proportion of Scottish and percentage of population with at least 4th grade education in the United States with a correlation coefficient (R) of 0.475 and weighted average of 98.4%. Similarly, the statistical analysis conducted on geographies consisting of 199,952,023 people shows a weak positive correlation between the proportion of Immigrants from Ghana and percentage of population with at least 4th grade education in the United States with a correlation coefficient (R) of 0.254 and weighted average of 96.9%, a difference of 1.5%.
Scottish vs Immigrants from Ghana 4th Grade

4th Grade Correlation Summary

MeasurementScottishImmigrants from Ghana
Minimum94.3%92.2%
Maximum100.0%100.0%
Range5.7%7.8%
Mean99.4%97.1%
Median100.0%97.1%
Interquartile 25% (IQ1)99.0%96.1%
Interquartile 75% (IQ3)100.0%98.3%
Interquartile Range (IQR)0.98%2.2%
Standard Deviation (Sample)0.99%1.9%
Standard Deviation (Population)0.99%1.8%

Similar Demographics by 4th Grade

Demographics Similar to Scottish by 4th Grade

In terms of 4th grade, the demographic groups most similar to Scottish are Dutch (98.4%, a difference of 0.0%), Pennsylvania German (98.4%, a difference of 0.0%), Polish (98.4%, a difference of 0.010%), Irish (98.4%, a difference of 0.010%), and Alaska Native (98.4%, a difference of 0.020%).
DemographicsRating | Rank4th Grade
Slovenes
100.0
/100
|
#9
Exceptional
98.4%
Alaskan Athabascans
100.0
/100
|
#10
Exceptional
98.4%
English
100.0
/100
|
#11
Exceptional
98.4%
Tlingit-Haida
100.0
/100
|
#12
Exceptional
98.4%
Swedes
100.0
/100
|
#13
Exceptional
98.4%
Carpatho Rusyns
100.0
/100
|
#14
Exceptional
98.4%
Dutch
100.0
/100
|
#15
Exceptional
98.4%
Scottish
100.0
/100
|
#16
Exceptional
98.4%
Pennsylvania Germans
100.0
/100
|
#17
Exceptional
98.4%
Poles
100.0
/100
|
#18
Exceptional
98.4%
Irish
100.0
/100
|
#19
Exceptional
98.4%
Alaska Natives
100.0
/100
|
#20
Exceptional
98.4%
Lithuanians
100.0
/100
|
#21
Exceptional
98.3%
Finns
100.0
/100
|
#22
Exceptional
98.3%
Sioux
100.0
/100
|
#23
Exceptional
98.3%

Demographics Similar to Immigrants from Ghana by 4th Grade

In terms of 4th grade, the demographic groups most similar to Immigrants from Ghana are Yaqui (96.9%, a difference of 0.0%), Trinidadian and Tobagonian (96.9%, a difference of 0.010%), Immigrants from Western Africa (96.9%, a difference of 0.010%), Immigrants from Bolivia (96.9%, a difference of 0.010%), and Immigrants from Peru (96.9%, a difference of 0.020%).
DemographicsRating | Rank4th Grade
Ghanaians
0.2
/100
|
#268
Tragic
97.0%
Immigrants | Uzbekistan
0.2
/100
|
#269
Tragic
96.9%
Cubans
0.2
/100
|
#270
Tragic
96.9%
Immigrants | Peru
0.1
/100
|
#271
Tragic
96.9%
Fijians
0.1
/100
|
#272
Tragic
96.9%
Immigrants | Cameroon
0.1
/100
|
#273
Tragic
96.9%
Trinidadians and Tobagonians
0.1
/100
|
#274
Tragic
96.9%
Immigrants | Ghana
0.1
/100
|
#275
Tragic
96.9%
Yaqui
0.1
/100
|
#276
Tragic
96.9%
Immigrants | Western Africa
0.1
/100
|
#277
Tragic
96.9%
Immigrants | Bolivia
0.1
/100
|
#278
Tragic
96.9%
Afghans
0.1
/100
|
#279
Tragic
96.9%
Barbadians
0.1
/100
|
#280
Tragic
96.9%
Immigrants | Hong Kong
0.1
/100
|
#281
Tragic
96.9%
Immigrants | Trinidad and Tobago
0.1
/100
|
#282
Tragic
96.8%