Scottish vs Alsatian Professional Degree

COMPARE

Scottish
Race
Ancestry
AfghanAfricanAlaska NativeAlaskan AthabascanAlbanianAleutAmericanApacheArabArapahoArgentineanArmenianAssyrian/Chaldean/SyriacAustralianAustrianBahamianBangladeshiBarbadianBasqueBelgianBelizeanBermudanBhutaneseBlackfeetBolivianBrazilianBritishBritish West IndianBulgarianBurmeseCajunCambodianCanadianCape VerdeanCarpatho RusynCelticCentral AmericanCentral American IndianCherokeeCheyenneChickasawChileanChineseChippewaChoctawColombianColvilleComancheCosta RicanCreeCreekCroatianCrowCubanCypriotCzechCzechoslovakianDanishDelawareDominicanDutchDutch West IndianEastern EuropeanEcuadorianEgyptianEnglishEstonianEthiopianEuropeanFijianFilipinoFinnishFrenchFrench American IndianFrench CanadianGermanGerman RussianGhanaianGreekGuamanian/ChamorroGuatemalanGuyaneseHaitianHmongHonduranHopiHoumaHungarianIcelanderIndian (Asian)IndonesianInupiatIranianIraqiIrishIroquoisIsraeliItalianJamaicanJapaneseJordanianKenyanKiowaKoreanLaotianLatvianLebaneseLiberianLithuanianLumbeeLuxembourgerMacedonianMalaysianMalteseMarshalleseMenomineeMexicanMexican American IndianMongolianMoroccanNative HawaiianNavajoNepaleseNew ZealanderNicaraguanNigerianNorthern EuropeanNorwegianOkinawanOsageOttawaPaiutePakistaniPalestinianPanamanianParaguayanPennsylvania GermanPeruvianPimaPolishPortuguesePotawatomiPuebloPuerto RicanPuget Sound SalishRomanianRussianSalvadoranSamoanScandinavianScotch-IrishScottishSeminoleSenegaleseSerbianShoshoneSierra LeoneanSiouxSlavicSlovakSloveneSomaliSouth AfricanSouth AmericanSouth American IndianSoviet UnionSpaniardSpanishSpanish AmericanSpanish American IndianSri LankanSubsaharan AfricanSudaneseSwedishSwissSyrianTaiwaneseThaiTlingit-HaidaTohono O'OdhamTonganTrinidadian and TobagonianTsimshianTurkishU.S. Virgin IslanderUgandanUkrainianUruguayanUteVenezuelanVietnameseWelshWest IndianYakamaYaquiYugoslavianYumanYup'ikZimbabwean
Immigration
NonimmigrantsImmigrantsAfghanistanAfricaAlbaniaArgentinaArmeniaAsiaAustraliaAustriaBahamasBangladeshBarbadosBelarusBelgiumBelizeBoliviaBosnia and HerzegovinaBrazilBulgariaBurma/MyanmarCabo VerdeCambodiaCameroonCanadaCaribbeanCentral AmericaChileChinaColombiaCongoCosta RicaCroatiaCubaCzechoslovakiaDenmarkDominicaDominican RepublicEastern AfricaEastern AsiaEastern EuropeEcuadorEgyptEl SalvadorEnglandEritreaEthiopiaEuropeFijiFranceGermanyGhanaGreeceGrenadaGuatemalaGuyanaHaitiHondurasHong KongHungaryIndiaIndonesiaIranIraqIrelandIsraelItalyJamaicaJapanJordanKazakhstanKenyaKoreaKuwaitLaosLatin AmericaLatviaLebanonLiberiaLithuaniaMalaysiaMexicoMicronesiaMiddle AfricaMoldovaMoroccoNepalNetherlandsNicaraguaNigeriaNorth AmericaNorth MacedoniaNorthern AfricaNorthern EuropeNorwayOceaniaPakistanPanamaPeruPhilippinesPolandPortugalRomaniaRussiaSaudi ArabiaScotlandSenegalSerbiaSierra LeoneSingaporeSomaliaSouth AfricaSouth AmericaSouth Central AsiaSouth Eastern AsiaSouthern EuropeSpainSri LankaSt. Vincent and the GrenadinesSudanSwedenSwitzerlandSyriaTaiwanThailandTrinidad and TobagoTurkeyUgandaUkraineUruguayUzbekistanVenezuelaVietnamWest IndiesWestern AfricaWestern AsiaWestern EuropeYemenZaireZimbabweAzores
Alsatian
Race
Ancestry
AfghanAfricanAlaska NativeAlaskan AthabascanAlbanianAleutAlsatianAmericanApacheArabArapahoArgentineanArmenianAssyrian/Chaldean/SyriacAustralianAustrianBahamianBangladeshiBarbadianBasqueBelgianBelizeanBermudanBhutaneseBlackfeetBolivianBrazilianBritishBritish West IndianBulgarianBurmeseCajunCambodianCanadianCape VerdeanCarpatho RusynCelticCentral AmericanCentral American IndianCherokeeCheyenneChickasawChileanChineseChippewaChoctawColombianColvilleComancheCosta RicanCreeCreekCroatianCrowCubanCypriotCzechCzechoslovakianDanishDelawareDominicanDutchDutch West IndianEastern EuropeanEcuadorianEgyptianEnglishEstonianEthiopianEuropeanFijianFilipinoFinnishFrenchFrench American IndianFrench CanadianGermanGerman RussianGhanaianGreekGuamanian/ChamorroGuatemalanGuyaneseHaitianHmongHonduranHopiHoumaHungarianIcelanderIndian (Asian)IndonesianInupiatIranianIraqiIrishIroquoisIsraeliItalianJamaicanJapaneseJordanianKenyanKiowaKoreanLaotianLatvianLebaneseLiberianLithuanianLumbeeLuxembourgerMacedonianMalaysianMalteseMarshalleseMenomineeMexicanMexican American IndianMongolianMoroccanNative HawaiianNavajoNepaleseNew ZealanderNicaraguanNigerianNorthern EuropeanNorwegianOkinawanOsageOttawaPaiutePakistaniPalestinianPanamanianParaguayanPennsylvania GermanPeruvianPimaPolishPortuguesePotawatomiPuebloPuerto RicanPuget Sound SalishRomanianRussianSalvadoranSamoanScandinavianScotch-IrishSeminoleSenegaleseSerbianShoshoneSierra LeoneanSiouxSlavicSlovakSloveneSomaliSouth AfricanSouth AmericanSouth American IndianSoviet UnionSpaniardSpanishSpanish AmericanSpanish American IndianSri LankanSubsaharan AfricanSudaneseSwedishSwissSyrianTaiwaneseThaiTlingit-HaidaTohono O'OdhamTonganTrinidadian and TobagonianTsimshianTurkishU.S. Virgin IslanderUgandanUkrainianUruguayanUteVenezuelanVietnameseWelshWest IndianYakamaYaquiYugoslavianYumanYup'ikZimbabwean
Immigration
NonimmigrantsImmigrantsAfghanistanAfricaAlbaniaArgentinaArmeniaAsiaAustraliaAustriaBahamasBangladeshBarbadosBelarusBelgiumBelizeBoliviaBosnia and HerzegovinaBrazilBulgariaBurma/MyanmarCabo VerdeCambodiaCameroonCanadaCaribbeanCentral AmericaChileChinaColombiaCongoCosta RicaCroatiaCubaCzechoslovakiaDenmarkDominicaDominican RepublicEastern AfricaEastern AsiaEastern EuropeEcuadorEgyptEl SalvadorEnglandEritreaEthiopiaEuropeFijiFranceGermanyGhanaGreeceGrenadaGuatemalaGuyanaHaitiHondurasHong KongHungaryIndiaIndonesiaIranIraqIrelandIsraelItalyJamaicaJapanJordanKazakhstanKenyaKoreaKuwaitLaosLatin AmericaLatviaLebanonLiberiaLithuaniaMalaysiaMexicoMicronesiaMiddle AfricaMoldovaMoroccoNepalNetherlandsNicaraguaNigeriaNorth AmericaNorth MacedoniaNorthern AfricaNorthern EuropeNorwayOceaniaPakistanPanamaPeruPhilippinesPolandPortugalRomaniaRussiaSaudi ArabiaScotlandSenegalSerbiaSierra LeoneSingaporeSomaliaSouth AfricaSouth AmericaSouth Central AsiaSouth Eastern AsiaSouthern EuropeSpainSri LankaSt. Vincent and the GrenadinesSudanSwedenSwitzerlandSyriaTaiwanThailandTrinidad and TobagoTurkeyUgandaUkraineUruguayUzbekistanVenezuelaVietnamWest IndiesWestern AfricaWestern AsiaWestern EuropeYemenZaireZimbabweAzores
Professional Degree
Income
Poverty
Unemployment
Labor Participation
Family Structure
Vehicle Availability
Education Level
Disability

Professional Degree Comparison

Scottish

Alsatians

Good
Exceptional
4.6%
PROFESSIONAL DEGREE
71.8/ 100
METRIC RATING
154th/ 347
METRIC RANK
5.2%
PROFESSIONAL DEGREE
99.3/ 100
METRIC RATING
94th/ 347
METRIC RANK

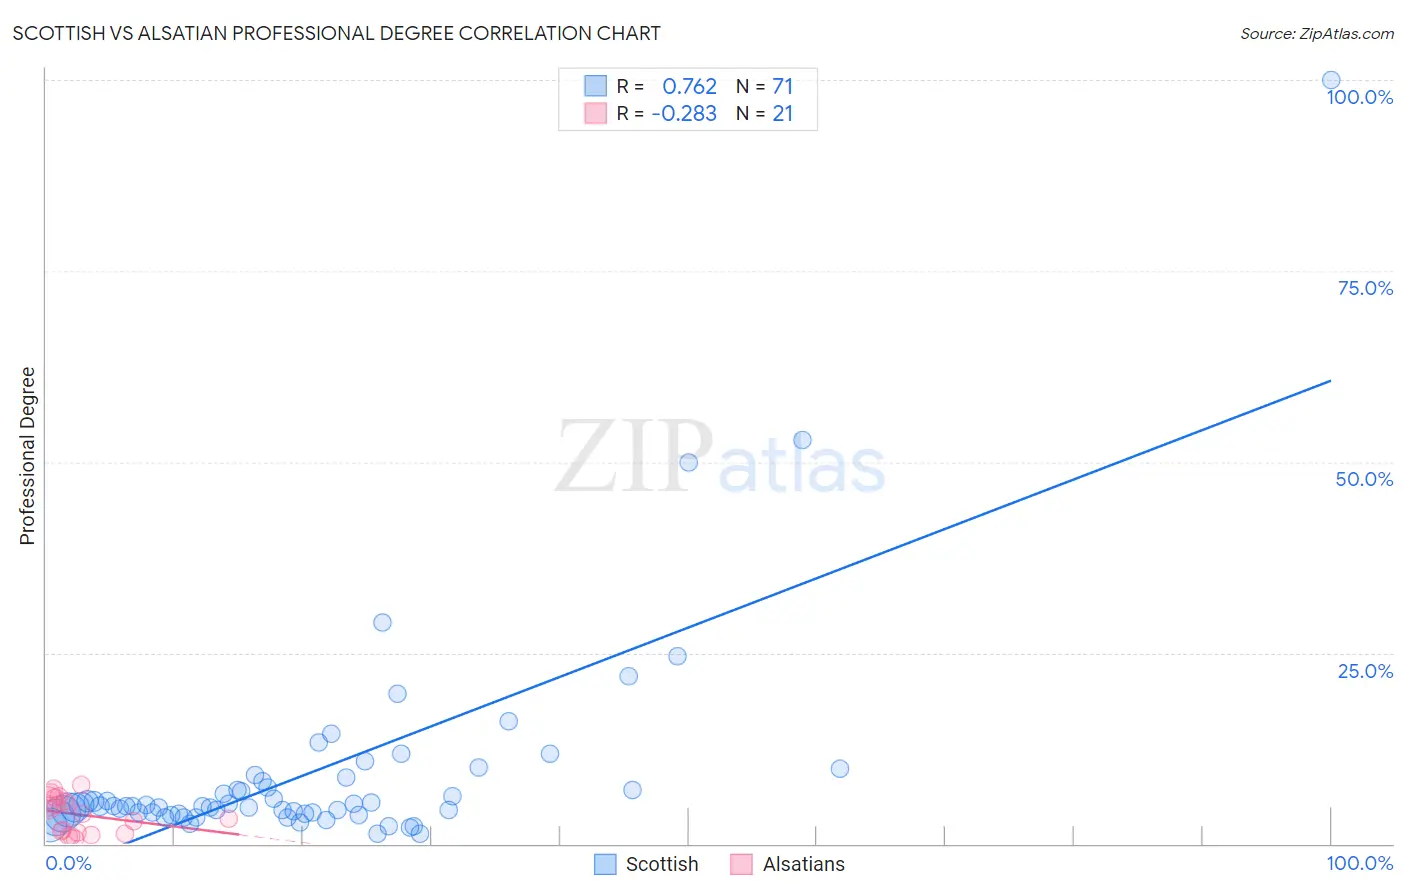
Scottish vs Alsatian Professional Degree Correlation Chart

The statistical analysis conducted on geographies consisting of 558,904,242 people shows a strong positive correlation between the proportion of Scottish and percentage of population with at least professional degree education in the United States with a correlation coefficient (R) of 0.762 and weighted average of 4.6%. Similarly, the statistical analysis conducted on geographies consisting of 82,635,637 people shows a weak negative correlation between the proportion of Alsatians and percentage of population with at least professional degree education in the United States with a correlation coefficient (R) of -0.283 and weighted average of 5.2%, a difference of 14.3%.
Scottish vs Alsatian Professional Degree

Professional Degree Correlation Summary

MeasurementScottishAlsatian
Minimum1.3%0.66%
Maximum100.0%7.8%
Range98.7%7.1%
Mean9.2%3.8%
Median4.9%4.0%
Interquartile 25% (IQ1)4.0%1.4%
Interquartile 75% (IQ3)8.2%5.9%
Interquartile Range (IQR)4.2%4.5%
Standard Deviation (Sample)14.2%2.4%
Standard Deviation (Population)14.1%2.3%

Similar Demographics by Professional Degree

Demographics Similar to Scottish by Professional Degree

In terms of professional degree, the demographic groups most similar to Scottish are Immigrants from Africa (4.6%, a difference of 0.12%), Immigrants from Uruguay (4.6%, a difference of 0.12%), Polish (4.6%, a difference of 0.14%), Slavic (4.5%, a difference of 0.18%), and Immigrants from Oceania (4.6%, a difference of 0.28%).
DemographicsRating | RankProfessional Degree
Colombians
77.7
/100
|
#147
Good
4.6%
Slovenes
76.1
/100
|
#148
Good
4.6%
Senegalese
75.3
/100
|
#149
Good
4.6%
Immigrants | Oceania
73.4
/100
|
#150
Good
4.6%
Poles
72.6
/100
|
#151
Good
4.6%
Immigrants | Africa
72.5
/100
|
#152
Good
4.6%
Immigrants | Uruguay
72.5
/100
|
#153
Good
4.6%
Scottish
71.8
/100
|
#154
Good
4.6%
Slavs
70.8
/100
|
#155
Good
4.5%
Swedes
69.9
/100
|
#156
Good
4.5%
Iraqis
69.8
/100
|
#157
Good
4.5%
Immigrants | Armenia
68.8
/100
|
#158
Good
4.5%
Vietnamese
68.4
/100
|
#159
Good
4.5%
Immigrants | Senegal
68.0
/100
|
#160
Good
4.5%
Assyrians/Chaldeans/Syriacs
67.4
/100
|
#161
Good
4.5%

Demographics Similar to Alsatians by Professional Degree

In terms of professional degree, the demographic groups most similar to Alsatians are Northern European (5.2%, a difference of 0.020%), Zimbabwean (5.2%, a difference of 0.18%), Immigrants from Uzbekistan (5.2%, a difference of 0.59%), Immigrants from Eastern Europe (5.2%, a difference of 0.66%), and Laotian (5.2%, a difference of 0.70%).
DemographicsRating | RankProfessional Degree
Immigrants | Chile
99.5
/100
|
#87
Exceptional
5.3%
Egyptians
99.5
/100
|
#88
Exceptional
5.3%
Chileans
99.5
/100
|
#89
Exceptional
5.3%
Immigrants | Scotland
99.5
/100
|
#90
Exceptional
5.3%
Laotians
99.5
/100
|
#91
Exceptional
5.2%
Immigrants | Eastern Europe
99.5
/100
|
#92
Exceptional
5.2%
Northern Europeans
99.3
/100
|
#93
Exceptional
5.2%
Alsatians
99.3
/100
|
#94
Exceptional
5.2%
Zimbabweans
99.3
/100
|
#95
Exceptional
5.2%
Immigrants | Uzbekistan
99.2
/100
|
#96
Exceptional
5.2%
Syrians
99.1
/100
|
#97
Exceptional
5.2%
Austrians
99.1
/100
|
#98
Exceptional
5.2%
Immigrants | Italy
99.1
/100
|
#99
Exceptional
5.2%
Ugandans
98.8
/100
|
#100
Exceptional
5.1%
Immigrants | Egypt
98.5
/100
|
#101
Exceptional
5.1%