Scotch-Irish vs Immigrants from Norway 2nd Grade

COMPARE

Scotch-Irish
Race
Ancestry
AfghanAfricanAlaska NativeAlaskan AthabascanAlbanianAleutAlsatianAmericanApacheArabArapahoArgentineanArmenianAssyrian/Chaldean/SyriacAustralianAustrianBahamianBangladeshiBarbadianBasqueBelgianBelizeanBermudanBhutaneseBlackfeetBolivianBrazilianBritishBritish West IndianBulgarianBurmeseCajunCambodianCanadianCape VerdeanCarpatho RusynCelticCentral AmericanCentral American IndianCherokeeCheyenneChickasawChileanChineseChippewaChoctawColombianColvilleComancheCosta RicanCreeCreekCroatianCrowCubanCypriotCzechCzechoslovakianDanishDelawareDominicanDutchDutch West IndianEastern EuropeanEcuadorianEgyptianEnglishEstonianEthiopianEuropeanFijianFilipinoFinnishFrenchFrench American IndianFrench CanadianGermanGerman RussianGhanaianGreekGuamanian/ChamorroGuatemalanGuyaneseHaitianHmongHonduranHopiHoumaHungarianIcelanderIndian (Asian)IndonesianInupiatIranianIraqiIrishIroquoisIsraeliItalianJamaicanJapaneseJordanianKenyanKiowaKoreanLaotianLatvianLebaneseLiberianLithuanianLumbeeLuxembourgerMacedonianMalaysianMalteseMarshalleseMenomineeMexicanMexican American IndianMongolianMoroccanNative HawaiianNavajoNepaleseNew ZealanderNicaraguanNigerianNorthern EuropeanNorwegianOkinawanOsageOttawaPaiutePakistaniPalestinianPanamanianParaguayanPennsylvania GermanPeruvianPimaPolishPortuguesePotawatomiPuebloPuerto RicanPuget Sound SalishRomanianRussianSalvadoranSamoanScandinavianScotch-IrishScottishSeminoleSenegaleseSerbianShoshoneSierra LeoneanSiouxSlavicSlovakSloveneSomaliSouth AfricanSouth AmericanSouth American IndianSoviet UnionSpaniardSpanishSpanish AmericanSpanish American IndianSri LankanSubsaharan AfricanSudaneseSwedishSwissSyrianTaiwaneseThaiTlingit-HaidaTohono O'OdhamTonganTrinidadian and TobagonianTsimshianTurkishU.S. Virgin IslanderUgandanUkrainianUruguayanUteVenezuelanVietnameseWelshWest IndianYakamaYaquiYugoslavianYumanYup'ikZimbabwean
Immigration
NonimmigrantsImmigrantsAfghanistanAfricaAlbaniaArgentinaArmeniaAsiaAustraliaAustriaBahamasBangladeshBarbadosBelarusBelgiumBelizeBoliviaBosnia and HerzegovinaBrazilBulgariaBurma/MyanmarCabo VerdeCambodiaCameroonCanadaCaribbeanCentral AmericaChileChinaColombiaCongoCosta RicaCroatiaCubaCzechoslovakiaDenmarkDominicaDominican RepublicEastern AfricaEastern AsiaEastern EuropeEcuadorEgyptEl SalvadorEnglandEritreaEthiopiaEuropeFijiFranceGermanyGhanaGreeceGrenadaGuatemalaGuyanaHaitiHondurasHong KongHungaryIndiaIndonesiaIranIraqIrelandIsraelItalyJamaicaJapanJordanKazakhstanKenyaKoreaKuwaitLaosLatin AmericaLatviaLebanonLiberiaLithuaniaMalaysiaMexicoMicronesiaMiddle AfricaMoldovaMoroccoNepalNetherlandsNicaraguaNigeriaNorth AmericaNorth MacedoniaNorthern AfricaNorthern EuropeOceaniaPakistanPanamaPeruPhilippinesPolandPortugalRomaniaRussiaSaudi ArabiaScotlandSenegalSerbiaSierra LeoneSingaporeSomaliaSouth AfricaSouth AmericaSouth Central AsiaSouth Eastern AsiaSouthern EuropeSpainSri LankaSt. Vincent and the GrenadinesSudanSwedenSwitzerlandSyriaTaiwanThailandTrinidad and TobagoTurkeyUgandaUkraineUruguayUzbekistanVenezuelaVietnamWest IndiesWestern AfricaWestern AsiaWestern EuropeYemenZaireZimbabweAzores
Immigrants from Norway
Race
Ancestry
AfghanAfricanAlaska NativeAlaskan AthabascanAlbanianAleutAlsatianAmericanApacheArabArapahoArgentineanArmenianAssyrian/Chaldean/SyriacAustralianAustrianBahamianBangladeshiBarbadianBasqueBelgianBelizeanBermudanBhutaneseBlackfeetBolivianBrazilianBritishBritish West IndianBulgarianBurmeseCajunCambodianCanadianCape VerdeanCarpatho RusynCelticCentral AmericanCentral American IndianCherokeeCheyenneChickasawChileanChineseChippewaChoctawColombianColvilleComancheCosta RicanCreeCreekCroatianCrowCubanCypriotCzechCzechoslovakianDanishDelawareDominicanDutchDutch West IndianEastern EuropeanEcuadorianEgyptianEnglishEstonianEthiopianEuropeanFijianFilipinoFinnishFrenchFrench American IndianFrench CanadianGermanGerman RussianGhanaianGreekGuamanian/ChamorroGuatemalanGuyaneseHaitianHmongHonduranHopiHoumaHungarianIcelanderIndian (Asian)IndonesianInupiatIranianIraqiIrishIroquoisIsraeliItalianJamaicanJapaneseJordanianKenyanKiowaKoreanLaotianLatvianLebaneseLiberianLithuanianLumbeeLuxembourgerMacedonianMalaysianMalteseMarshalleseMenomineeMexicanMexican American IndianMongolianMoroccanNative HawaiianNavajoNepaleseNew ZealanderNicaraguanNigerianNorthern EuropeanNorwegianOkinawanOsageOttawaPaiutePakistaniPalestinianPanamanianParaguayanPennsylvania GermanPeruvianPimaPolishPortuguesePotawatomiPuebloPuerto RicanPuget Sound SalishRomanianRussianSalvadoranSamoanScandinavianScottishSeminoleSenegaleseSerbianShoshoneSierra LeoneanSiouxSlavicSlovakSloveneSomaliSouth AfricanSouth AmericanSouth American IndianSoviet UnionSpaniardSpanishSpanish AmericanSpanish American IndianSri LankanSubsaharan AfricanSudaneseSwedishSwissSyrianTaiwaneseThaiTlingit-HaidaTohono O'OdhamTonganTrinidadian and TobagonianTsimshianTurkishU.S. Virgin IslanderUgandanUkrainianUruguayanUteVenezuelanVietnameseWelshWest IndianYakamaYaquiYugoslavianYumanYup'ikZimbabwean
Immigration
NonimmigrantsImmigrantsAfghanistanAfricaAlbaniaArgentinaArmeniaAsiaAustraliaAustriaBahamasBangladeshBarbadosBelarusBelgiumBelizeBoliviaBosnia and HerzegovinaBrazilBulgariaBurma/MyanmarCabo VerdeCambodiaCameroonCanadaCaribbeanCentral AmericaChileChinaColombiaCongoCosta RicaCroatiaCubaCzechoslovakiaDenmarkDominicaDominican RepublicEastern AfricaEastern AsiaEastern EuropeEcuadorEgyptEl SalvadorEnglandEritreaEthiopiaEuropeFijiFranceGermanyGhanaGreeceGrenadaGuatemalaGuyanaHaitiHondurasHong KongHungaryIndiaIndonesiaIranIraqIrelandIsraelItalyJamaicaJapanJordanKazakhstanKenyaKoreaKuwaitLaosLatin AmericaLatviaLebanonLiberiaLithuaniaMalaysiaMexicoMicronesiaMiddle AfricaMoldovaMoroccoNepalNetherlandsNicaraguaNigeriaNorth AmericaNorth MacedoniaNorthern AfricaNorthern EuropeNorwayOceaniaPakistanPanamaPeruPhilippinesPolandPortugalRomaniaRussiaSaudi ArabiaScotlandSenegalSerbiaSierra LeoneSingaporeSomaliaSouth AfricaSouth AmericaSouth Central AsiaSouth Eastern AsiaSouthern EuropeSpainSri LankaSt. Vincent and the GrenadinesSudanSwedenSwitzerlandSyriaTaiwanThailandTrinidad and TobagoTurkeyUgandaUkraineUruguayUzbekistanVenezuelaVietnamWest IndiesWestern AfricaWestern AsiaWestern EuropeYemenZaireZimbabweAzores
2nd Grade
Income
Poverty
Unemployment
Labor Participation
Family Structure
Vehicle Availability
Education Level
Disability

2nd Grade Comparison

Scotch-Irish

Immigrants from Norway

Exceptional
Exceptional
98.5%
2ND GRADE
100.0/ 100
METRIC RATING
25th/ 347
METRIC RANK
98.1%
2ND GRADE
96.5/ 100
METRIC RATING
113th/ 347
METRIC RANK

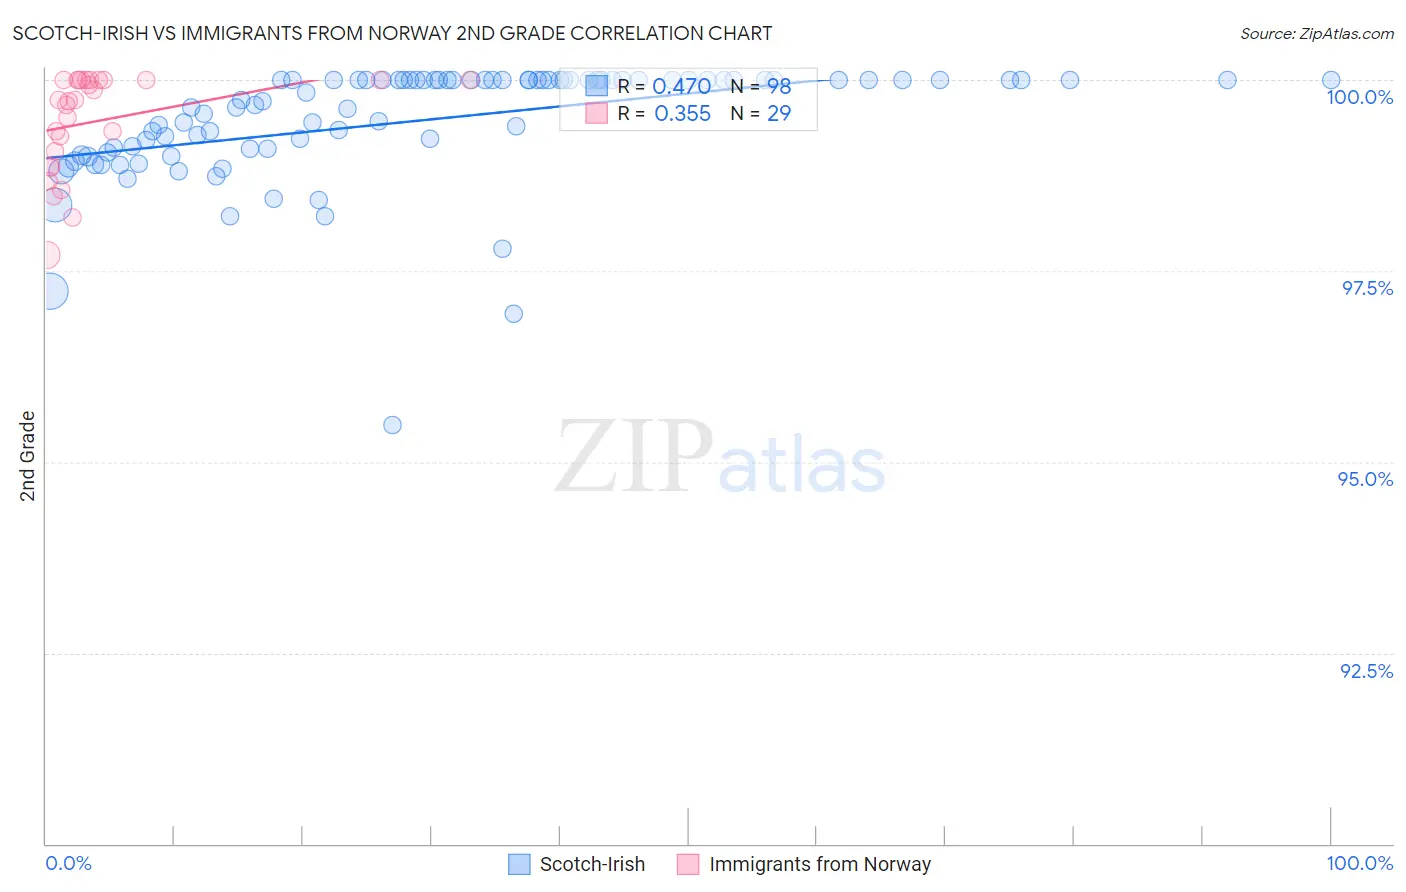
Scotch-Irish vs Immigrants from Norway 2nd Grade Correlation Chart

The statistical analysis conducted on geographies consisting of 548,777,407 people shows a moderate positive correlation between the proportion of Scotch-Irish and percentage of population with at least 2nd grade education in the United States with a correlation coefficient (R) of 0.470 and weighted average of 98.5%. Similarly, the statistical analysis conducted on geographies consisting of 116,716,420 people shows a mild positive correlation between the proportion of Immigrants from Norway and percentage of population with at least 2nd grade education in the United States with a correlation coefficient (R) of 0.355 and weighted average of 98.1%, a difference of 0.43%.
Scotch-Irish vs Immigrants from Norway 2nd Grade

2nd Grade Correlation Summary

MeasurementScotch-IrishImmigrants from Norway
Minimum95.5%97.7%
Maximum100.0%100.0%
Range4.5%2.3%
Mean99.5%99.5%
Median99.9%99.7%
Interquartile 25% (IQ1)99.1%99.0%
Interquartile 75% (IQ3)100.0%100.0%
Interquartile Range (IQR)0.90%1.0%
Standard Deviation (Sample)0.77%0.65%
Standard Deviation (Population)0.76%0.64%

Similar Demographics by 2nd Grade

Demographics Similar to Scotch-Irish by 2nd Grade

In terms of 2nd grade, the demographic groups most similar to Scotch-Irish are Polish (98.5%, a difference of 0.0%), Danish (98.5%, a difference of 0.0%), Pennsylvania German (98.5%, a difference of 0.0%), Finnish (98.5%, a difference of 0.010%), and Sioux (98.5%, a difference of 0.010%).
DemographicsRating | Rank2nd Grade
Irish
100.0
/100
|
#18
Exceptional
98.6%
Finns
100.0
/100
|
#19
Exceptional
98.5%
Sioux
100.0
/100
|
#20
Exceptional
98.5%
Lithuanians
100.0
/100
|
#21
Exceptional
98.5%
Poles
100.0
/100
|
#22
Exceptional
98.5%
Danes
100.0
/100
|
#23
Exceptional
98.5%
Pennsylvania Germans
100.0
/100
|
#24
Exceptional
98.5%
Scotch-Irish
100.0
/100
|
#25
Exceptional
98.5%
Welsh
100.0
/100
|
#26
Exceptional
98.5%
Croatians
100.0
/100
|
#27
Exceptional
98.5%
Arapaho
100.0
/100
|
#28
Exceptional
98.5%
French
100.0
/100
|
#29
Exceptional
98.5%
Europeans
100.0
/100
|
#30
Exceptional
98.5%
Czechs
100.0
/100
|
#31
Exceptional
98.5%
French Canadians
100.0
/100
|
#32
Exceptional
98.5%

Demographics Similar to Immigrants from Norway by 2nd Grade

In terms of 2nd grade, the demographic groups most similar to Immigrants from Norway are Colville (98.1%, a difference of 0.0%), Immigrants from Latvia (98.1%, a difference of 0.0%), Immigrants from Singapore (98.1%, a difference of 0.010%), Immigrants from Czechoslovakia (98.1%, a difference of 0.010%), and Iranian (98.1%, a difference of 0.010%).
DemographicsRating | Rank2nd Grade
Bhutanese
97.5
/100
|
#106
Exceptional
98.1%
German Russians
97.4
/100
|
#107
Exceptional
98.1%
Immigrants | Switzerland
97.3
/100
|
#108
Exceptional
98.1%
Basques
97.2
/100
|
#109
Exceptional
98.1%
Immigrants | Singapore
97.0
/100
|
#110
Exceptional
98.1%
Immigrants | Czechoslovakia
96.9
/100
|
#111
Exceptional
98.1%
Colville
96.6
/100
|
#112
Exceptional
98.1%
Immigrants | Norway
96.5
/100
|
#113
Exceptional
98.1%
Immigrants | Latvia
96.4
/100
|
#114
Exceptional
98.1%
Iranians
95.9
/100
|
#115
Exceptional
98.1%
Spanish
95.8
/100
|
#116
Exceptional
98.1%
Ute
95.7
/100
|
#117
Exceptional
98.1%
Immigrants | France
95.6
/100
|
#118
Exceptional
98.1%
Thais
95.3
/100
|
#119
Exceptional
98.1%
Okinawans
94.9
/100
|
#120
Exceptional
98.1%