Salvadoran vs Iraqi High School Diploma

COMPARE

Salvadoran
Race
Ancestry
AfghanAfricanAlaska NativeAlaskan AthabascanAlbanianAleutAlsatianAmericanApacheArabArapahoArgentineanArmenianAssyrian/Chaldean/SyriacAustralianAustrianBahamianBangladeshiBarbadianBasqueBelgianBelizeanBermudanBhutaneseBlackfeetBolivianBrazilianBritishBritish West IndianBulgarianBurmeseCajunCambodianCanadianCape VerdeanCarpatho RusynCelticCentral AmericanCentral American IndianCherokeeCheyenneChickasawChileanChineseChippewaChoctawColombianColvilleComancheCosta RicanCreeCreekCroatianCrowCubanCypriotCzechCzechoslovakianDanishDelawareDominicanDutchDutch West IndianEastern EuropeanEcuadorianEgyptianEnglishEstonianEthiopianEuropeanFijianFilipinoFinnishFrenchFrench American IndianFrench CanadianGermanGerman RussianGhanaianGreekGuamanian/ChamorroGuatemalanGuyaneseHaitianHmongHonduranHopiHoumaHungarianIcelanderIndian (Asian)IndonesianInupiatIranianIrishIroquoisIsraeliItalianJamaicanJapaneseJordanianKenyanKiowaKoreanLaotianLatvianLebaneseLiberianLithuanianLumbeeLuxembourgerMacedonianMalaysianMalteseMarshalleseMenomineeMexicanMexican American IndianMongolianMoroccanNative HawaiianNavajoNepaleseNew ZealanderNicaraguanNigerianNorthern EuropeanNorwegianOkinawanOsageOttawaPaiutePakistaniPalestinianPanamanianParaguayanPennsylvania GermanPeruvianPimaPolishPortuguesePotawatomiPuebloPuerto RicanPuget Sound SalishRomanianRussianSalvadoranSamoanScandinavianScotch-IrishScottishSeminoleSenegaleseSerbianShoshoneSierra LeoneanSiouxSlavicSlovakSloveneSomaliSouth AfricanSouth AmericanSouth American IndianSoviet UnionSpaniardSpanishSpanish AmericanSpanish American IndianSri LankanSubsaharan AfricanSudaneseSwedishSwissSyrianTaiwaneseThaiTlingit-HaidaTohono O'OdhamTonganTrinidadian and TobagonianTsimshianTurkishU.S. Virgin IslanderUgandanUkrainianUruguayanUteVenezuelanVietnameseWelshWest IndianYakamaYaquiYugoslavianYumanYup'ikZimbabwean
Immigration
NonimmigrantsImmigrantsAfghanistanAfricaAlbaniaArgentinaArmeniaAsiaAustraliaAustriaBahamasBangladeshBarbadosBelarusBelgiumBelizeBoliviaBosnia and HerzegovinaBrazilBulgariaBurma/MyanmarCabo VerdeCambodiaCameroonCanadaCaribbeanCentral AmericaChileChinaColombiaCongoCosta RicaCroatiaCubaCzechoslovakiaDenmarkDominicaDominican RepublicEastern AfricaEastern AsiaEastern EuropeEcuadorEgyptEl SalvadorEnglandEritreaEthiopiaEuropeFijiFranceGermanyGhanaGreeceGrenadaGuatemalaGuyanaHaitiHondurasHong KongHungaryIndiaIndonesiaIranIraqIrelandIsraelItalyJamaicaJapanJordanKazakhstanKenyaKoreaKuwaitLaosLatin AmericaLatviaLebanonLiberiaLithuaniaMalaysiaMexicoMicronesiaMiddle AfricaMoldovaMoroccoNepalNetherlandsNicaraguaNigeriaNorth AmericaNorth MacedoniaNorthern AfricaNorthern EuropeNorwayOceaniaPakistanPanamaPeruPhilippinesPolandPortugalRomaniaRussiaSaudi ArabiaScotlandSenegalSerbiaSierra LeoneSingaporeSomaliaSouth AfricaSouth AmericaSouth Central AsiaSouth Eastern AsiaSouthern EuropeSpainSri LankaSt. Vincent and the GrenadinesSudanSwedenSwitzerlandSyriaTaiwanThailandTrinidad and TobagoTurkeyUgandaUkraineUruguayUzbekistanVenezuelaVietnamWest IndiesWestern AfricaWestern AsiaWestern EuropeYemenZaireZimbabweAzores
Iraqi
Race
Ancestry
AfghanAfricanAlaska NativeAlaskan AthabascanAlbanianAleutAlsatianAmericanApacheArabArapahoArgentineanArmenianAssyrian/Chaldean/SyriacAustralianAustrianBahamianBangladeshiBarbadianBasqueBelgianBelizeanBermudanBhutaneseBlackfeetBolivianBrazilianBritishBritish West IndianBulgarianBurmeseCajunCambodianCanadianCape VerdeanCarpatho RusynCelticCentral AmericanCentral American IndianCherokeeCheyenneChickasawChileanChineseChippewaChoctawColombianColvilleComancheCosta RicanCreeCreekCroatianCrowCubanCypriotCzechCzechoslovakianDanishDelawareDominicanDutchDutch West IndianEastern EuropeanEcuadorianEgyptianEnglishEstonianEthiopianEuropeanFijianFilipinoFinnishFrenchFrench American IndianFrench CanadianGermanGerman RussianGhanaianGreekGuamanian/ChamorroGuatemalanGuyaneseHaitianHmongHonduranHopiHoumaHungarianIcelanderIndian (Asian)IndonesianInupiatIranianIraqiIrishIroquoisIsraeliItalianJamaicanJapaneseJordanianKenyanKiowaKoreanLaotianLatvianLebaneseLiberianLithuanianLumbeeLuxembourgerMacedonianMalaysianMalteseMarshalleseMenomineeMexicanMexican American IndianMongolianMoroccanNative HawaiianNavajoNepaleseNew ZealanderNicaraguanNigerianNorthern EuropeanNorwegianOkinawanOsageOttawaPaiutePakistaniPalestinianPanamanianParaguayanPennsylvania GermanPeruvianPimaPolishPortuguesePotawatomiPuebloPuerto RicanPuget Sound SalishRomanianRussianSamoanScandinavianScotch-IrishScottishSeminoleSenegaleseSerbianShoshoneSierra LeoneanSiouxSlavicSlovakSloveneSomaliSouth AfricanSouth AmericanSouth American IndianSoviet UnionSpaniardSpanishSpanish AmericanSpanish American IndianSri LankanSubsaharan AfricanSudaneseSwedishSwissSyrianTaiwaneseThaiTlingit-HaidaTohono O'OdhamTonganTrinidadian and TobagonianTsimshianTurkishU.S. Virgin IslanderUgandanUkrainianUruguayanUteVenezuelanVietnameseWelshWest IndianYakamaYaquiYugoslavianYumanYup'ikZimbabwean
Immigration
NonimmigrantsImmigrantsAfghanistanAfricaAlbaniaArgentinaArmeniaAsiaAustraliaAustriaBahamasBangladeshBarbadosBelarusBelgiumBelizeBoliviaBosnia and HerzegovinaBrazilBulgariaBurma/MyanmarCabo VerdeCambodiaCameroonCanadaCaribbeanCentral AmericaChileChinaColombiaCongoCosta RicaCroatiaCubaCzechoslovakiaDenmarkDominicaDominican RepublicEastern AfricaEastern AsiaEastern EuropeEcuadorEgyptEl SalvadorEnglandEritreaEthiopiaEuropeFijiFranceGermanyGhanaGreeceGrenadaGuatemalaGuyanaHaitiHondurasHong KongHungaryIndiaIndonesiaIranIraqIrelandIsraelItalyJamaicaJapanJordanKazakhstanKenyaKoreaKuwaitLaosLatin AmericaLatviaLebanonLiberiaLithuaniaMalaysiaMexicoMicronesiaMiddle AfricaMoldovaMoroccoNepalNetherlandsNicaraguaNigeriaNorth AmericaNorth MacedoniaNorthern AfricaNorthern EuropeNorwayOceaniaPakistanPanamaPeruPhilippinesPolandPortugalRomaniaRussiaSaudi ArabiaScotlandSenegalSerbiaSierra LeoneSingaporeSomaliaSouth AfricaSouth AmericaSouth Central AsiaSouth Eastern AsiaSouthern EuropeSpainSri LankaSt. Vincent and the GrenadinesSudanSwedenSwitzerlandSyriaTaiwanThailandTrinidad and TobagoTurkeyUgandaUkraineUruguayUzbekistanVenezuelaVietnamWest IndiesWestern AfricaWestern AsiaWestern EuropeYemenZaireZimbabweAzores
High School Diploma
Income
Poverty
Unemployment
Labor Participation
Family Structure
Vehicle Availability
Education Level
Disability

High School Diploma Comparison

Salvadorans

Iraqis

Tragic
Good
81.7%
HIGH SCHOOL DIPLOMA
0.0/ 100
METRIC RATING
338th/ 347
METRIC RANK
89.5%
HIGH SCHOOL DIPLOMA
73.9/ 100
METRIC RATING
147th/ 347
METRIC RANK

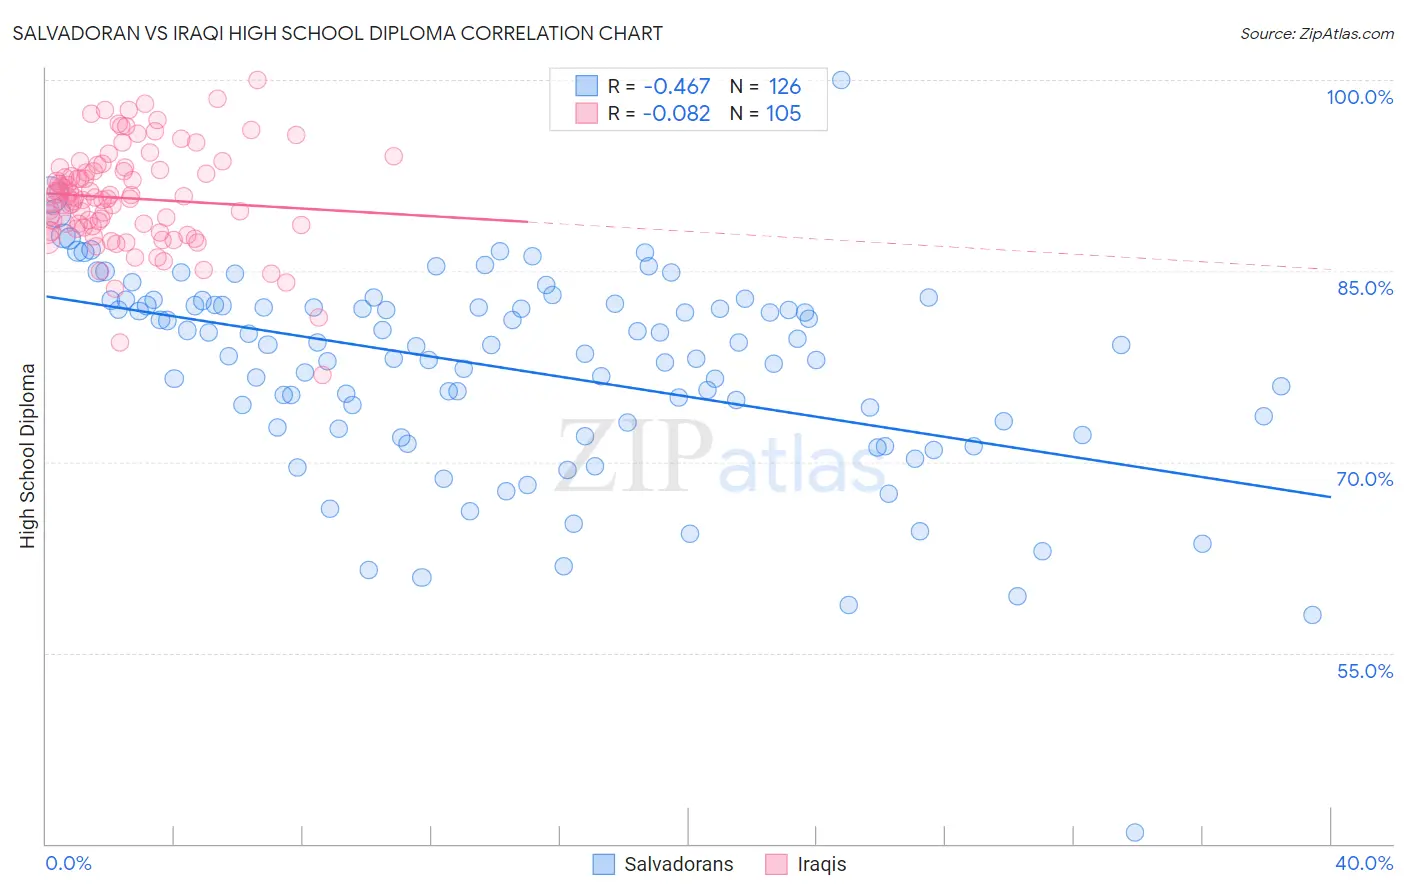
Salvadoran vs Iraqi High School Diploma Correlation Chart

The statistical analysis conducted on geographies consisting of 399,034,198 people shows a moderate negative correlation between the proportion of Salvadorans and percentage of population with at least high school diploma education in the United States with a correlation coefficient (R) of -0.467 and weighted average of 81.7%. Similarly, the statistical analysis conducted on geographies consisting of 170,614,457 people shows a slight negative correlation between the proportion of Iraqis and percentage of population with at least high school diploma education in the United States with a correlation coefficient (R) of -0.082 and weighted average of 89.5%, a difference of 9.6%.
Salvadoran vs Iraqi High School Diploma

High School Diploma Correlation Summary

MeasurementSalvadoranIraqi
Minimum40.9%76.8%
Maximum100.0%100.0%
Range59.1%23.2%
Mean77.2%90.7%
Median79.1%90.7%
Interquartile 25% (IQ1)72.7%88.4%
Interquartile 75% (IQ3)82.3%93.0%
Interquartile Range (IQR)9.6%4.6%
Standard Deviation (Sample)8.1%4.0%
Standard Deviation (Population)8.1%4.0%

Similar Demographics by High School Diploma

Demographics Similar to Salvadorans by High School Diploma

In terms of high school diploma, the demographic groups most similar to Salvadorans are Pima (81.6%, a difference of 0.10%), Immigrants from Yemen (81.8%, a difference of 0.17%), Houma (81.5%, a difference of 0.20%), Immigrants from Dominican Republic (82.0%, a difference of 0.32%), and Guatemalan (82.0%, a difference of 0.33%).
DemographicsRating | RankHigh School Diploma
Central Americans
0.0
/100
|
#331
Tragic
82.5%
Immigrants | Honduras
0.0
/100
|
#332
Tragic
82.5%
Immigrants | Latin America
0.0
/100
|
#333
Tragic
82.1%
Tohono O'odham
0.0
/100
|
#334
Tragic
82.1%
Guatemalans
0.0
/100
|
#335
Tragic
82.0%
Immigrants | Dominican Republic
0.0
/100
|
#336
Tragic
82.0%
Immigrants | Yemen
0.0
/100
|
#337
Tragic
81.8%
Salvadorans
0.0
/100
|
#338
Tragic
81.7%
Pima
0.0
/100
|
#339
Tragic
81.6%
Houma
0.0
/100
|
#340
Tragic
81.5%
Mexicans
0.0
/100
|
#341
Tragic
81.4%
Immigrants | Guatemala
0.0
/100
|
#342
Tragic
81.4%
Immigrants | El Salvador
0.0
/100
|
#343
Tragic
80.8%
Immigrants | Central America
0.0
/100
|
#344
Tragic
80.1%
Yakama
0.0
/100
|
#345
Tragic
80.0%

Demographics Similar to Iraqis by High School Diploma

In terms of high school diploma, the demographic groups most similar to Iraqis are Immigrants from Lebanon (89.5%, a difference of 0.010%), Immigrants from Poland (89.5%, a difference of 0.020%), Argentinean (89.5%, a difference of 0.030%), Immigrants from Brazil (89.5%, a difference of 0.050%), and Immigrants from Spain (89.5%, a difference of 0.050%).
DemographicsRating | RankHigh School Diploma
Immigrants | Egypt
81.2
/100
|
#140
Excellent
89.6%
Chileans
79.0
/100
|
#141
Good
89.6%
Indians (Asian)
78.8
/100
|
#142
Good
89.6%
Pakistanis
78.3
/100
|
#143
Good
89.6%
Immigrants | Kenya
78.0
/100
|
#144
Good
89.6%
Immigrants | Brazil
76.6
/100
|
#145
Good
89.5%
Immigrants | Spain
76.2
/100
|
#146
Good
89.5%
Iraqis
73.9
/100
|
#147
Good
89.5%
Immigrants | Lebanon
73.4
/100
|
#148
Good
89.5%
Immigrants | Poland
72.9
/100
|
#149
Good
89.5%
Argentineans
72.3
/100
|
#150
Good
89.5%
Paraguayans
71.4
/100
|
#151
Good
89.5%
Asians
70.7
/100
|
#152
Good
89.4%
Immigrants | Iraq
68.7
/100
|
#153
Good
89.4%
Alsatians
66.8
/100
|
#154
Good
89.4%