Romanian vs Immigrants from Ireland 9th Grade

COMPARE

Romanian
Race
Ancestry
AfghanAfricanAlaska NativeAlaskan AthabascanAlbanianAleutAlsatianAmericanApacheArabArapahoArgentineanArmenianAssyrian/Chaldean/SyriacAustralianAustrianBahamianBangladeshiBarbadianBasqueBelgianBelizeanBermudanBhutaneseBlackfeetBolivianBrazilianBritishBritish West IndianBulgarianBurmeseCajunCambodianCanadianCape VerdeanCarpatho RusynCelticCentral AmericanCentral American IndianCherokeeCheyenneChickasawChileanChineseChippewaChoctawColombianColvilleComancheCosta RicanCreeCreekCroatianCrowCubanCypriotCzechCzechoslovakianDanishDelawareDominicanDutchDutch West IndianEastern EuropeanEcuadorianEgyptianEnglishEstonianEthiopianEuropeanFijianFilipinoFinnishFrenchFrench American IndianFrench CanadianGermanGerman RussianGhanaianGreekGuamanian/ChamorroGuatemalanGuyaneseHaitianHmongHonduranHopiHoumaHungarianIcelanderIndian (Asian)IndonesianInupiatIranianIraqiIrishIroquoisIsraeliItalianJamaicanJapaneseJordanianKenyanKiowaKoreanLaotianLatvianLebaneseLiberianLithuanianLumbeeLuxembourgerMacedonianMalaysianMalteseMarshalleseMenomineeMexicanMexican American IndianMongolianMoroccanNative HawaiianNavajoNepaleseNew ZealanderNicaraguanNigerianNorthern EuropeanNorwegianOkinawanOsageOttawaPaiutePakistaniPalestinianPanamanianParaguayanPennsylvania GermanPeruvianPimaPolishPortuguesePotawatomiPuebloPuerto RicanPuget Sound SalishRomanianRussianSalvadoranSamoanScandinavianScotch-IrishScottishSeminoleSenegaleseSerbianShoshoneSierra LeoneanSiouxSlavicSlovakSloveneSomaliSouth AfricanSouth AmericanSouth American IndianSoviet UnionSpaniardSpanishSpanish AmericanSpanish American IndianSri LankanSubsaharan AfricanSudaneseSwedishSwissSyrianTaiwaneseThaiTlingit-HaidaTohono O'OdhamTonganTrinidadian and TobagonianTsimshianTurkishU.S. Virgin IslanderUgandanUkrainianUruguayanUteVenezuelanVietnameseWelshWest IndianYakamaYaquiYugoslavianYumanYup'ikZimbabwean
Immigration
NonimmigrantsImmigrantsAfghanistanAfricaAlbaniaArgentinaArmeniaAsiaAustraliaAustriaBahamasBangladeshBarbadosBelarusBelgiumBelizeBoliviaBosnia and HerzegovinaBrazilBulgariaBurma/MyanmarCabo VerdeCambodiaCameroonCanadaCaribbeanCentral AmericaChileChinaColombiaCongoCosta RicaCroatiaCubaCzechoslovakiaDenmarkDominicaDominican RepublicEastern AfricaEastern AsiaEastern EuropeEcuadorEgyptEl SalvadorEnglandEritreaEthiopiaEuropeFijiFranceGermanyGhanaGreeceGrenadaGuatemalaGuyanaHaitiHondurasHong KongHungaryIndiaIndonesiaIranIraqIsraelItalyJamaicaJapanJordanKazakhstanKenyaKoreaKuwaitLaosLatin AmericaLatviaLebanonLiberiaLithuaniaMalaysiaMexicoMicronesiaMiddle AfricaMoldovaMoroccoNepalNetherlandsNicaraguaNigeriaNorth AmericaNorth MacedoniaNorthern AfricaNorthern EuropeNorwayOceaniaPakistanPanamaPeruPhilippinesPolandPortugalRomaniaRussiaSaudi ArabiaScotlandSenegalSerbiaSierra LeoneSingaporeSomaliaSouth AfricaSouth AmericaSouth Central AsiaSouth Eastern AsiaSouthern EuropeSpainSri LankaSt. Vincent and the GrenadinesSudanSwedenSwitzerlandSyriaTaiwanThailandTrinidad and TobagoTurkeyUgandaUkraineUruguayUzbekistanVenezuelaVietnamWest IndiesWestern AfricaWestern AsiaWestern EuropeYemenZaireZimbabweAzores
Immigrants from Ireland
Race
Ancestry
AfghanAfricanAlaska NativeAlaskan AthabascanAlbanianAleutAlsatianAmericanApacheArabArapahoArgentineanArmenianAssyrian/Chaldean/SyriacAustralianAustrianBahamianBangladeshiBarbadianBasqueBelgianBelizeanBermudanBhutaneseBlackfeetBolivianBrazilianBritishBritish West IndianBulgarianBurmeseCajunCambodianCanadianCape VerdeanCarpatho RusynCelticCentral AmericanCentral American IndianCherokeeCheyenneChickasawChileanChineseChippewaChoctawColombianColvilleComancheCosta RicanCreeCreekCroatianCrowCubanCypriotCzechCzechoslovakianDanishDelawareDominicanDutchDutch West IndianEastern EuropeanEcuadorianEgyptianEnglishEstonianEthiopianEuropeanFijianFilipinoFinnishFrenchFrench American IndianFrench CanadianGermanGerman RussianGhanaianGreekGuamanian/ChamorroGuatemalanGuyaneseHaitianHmongHonduranHopiHoumaHungarianIcelanderIndian (Asian)IndonesianInupiatIranianIraqiIrishIroquoisIsraeliItalianJamaicanJapaneseJordanianKenyanKiowaKoreanLaotianLatvianLebaneseLiberianLithuanianLumbeeLuxembourgerMacedonianMalaysianMalteseMarshalleseMenomineeMexicanMexican American IndianMongolianMoroccanNative HawaiianNavajoNepaleseNew ZealanderNicaraguanNigerianNorthern EuropeanNorwegianOkinawanOsageOttawaPaiutePakistaniPalestinianPanamanianParaguayanPennsylvania GermanPeruvianPimaPolishPortuguesePotawatomiPuebloPuerto RicanPuget Sound SalishRussianSalvadoranSamoanScandinavianScotch-IrishScottishSeminoleSenegaleseSerbianShoshoneSierra LeoneanSiouxSlavicSlovakSloveneSomaliSouth AfricanSouth AmericanSouth American IndianSoviet UnionSpaniardSpanishSpanish AmericanSpanish American IndianSri LankanSubsaharan AfricanSudaneseSwedishSwissSyrianTaiwaneseThaiTlingit-HaidaTohono O'OdhamTonganTrinidadian and TobagonianTsimshianTurkishU.S. Virgin IslanderUgandanUkrainianUruguayanUteVenezuelanVietnameseWelshWest IndianYakamaYaquiYugoslavianYumanYup'ikZimbabwean
Immigration
NonimmigrantsImmigrantsAfghanistanAfricaAlbaniaArgentinaArmeniaAsiaAustraliaAustriaBahamasBangladeshBarbadosBelarusBelgiumBelizeBoliviaBosnia and HerzegovinaBrazilBulgariaBurma/MyanmarCabo VerdeCambodiaCameroonCanadaCaribbeanCentral AmericaChileChinaColombiaCongoCosta RicaCroatiaCubaCzechoslovakiaDenmarkDominicaDominican RepublicEastern AfricaEastern AsiaEastern EuropeEcuadorEgyptEl SalvadorEnglandEritreaEthiopiaEuropeFijiFranceGermanyGhanaGreeceGrenadaGuatemalaGuyanaHaitiHondurasHong KongHungaryIndiaIndonesiaIranIraqIrelandIsraelItalyJamaicaJapanJordanKazakhstanKenyaKoreaKuwaitLaosLatin AmericaLatviaLebanonLiberiaLithuaniaMalaysiaMexicoMicronesiaMiddle AfricaMoldovaMoroccoNepalNetherlandsNicaraguaNigeriaNorth AmericaNorth MacedoniaNorthern AfricaNorthern EuropeNorwayOceaniaPakistanPanamaPeruPhilippinesPolandPortugalRomaniaRussiaSaudi ArabiaScotlandSenegalSerbiaSierra LeoneSingaporeSomaliaSouth AfricaSouth AmericaSouth Central AsiaSouth Eastern AsiaSouthern EuropeSpainSri LankaSt. Vincent and the GrenadinesSudanSwedenSwitzerlandSyriaTaiwanThailandTrinidad and TobagoTurkeyUgandaUkraineUruguayUzbekistanVenezuelaVietnamWest IndiesWestern AfricaWestern AsiaWestern EuropeYemenZaireZimbabweAzores
9th Grade
Income
Poverty
Unemployment
Labor Participation
Family Structure
Vehicle Availability
Education Level
Disability

9th Grade Comparison

Romanians

Immigrants from Ireland

Exceptional
Exceptional
95.7%
9TH GRADE
99.3/ 100
METRIC RATING
79th/ 347
METRIC RANK
95.8%
9TH GRADE
99.6/ 100
METRIC RATING
68th/ 347
METRIC RANK

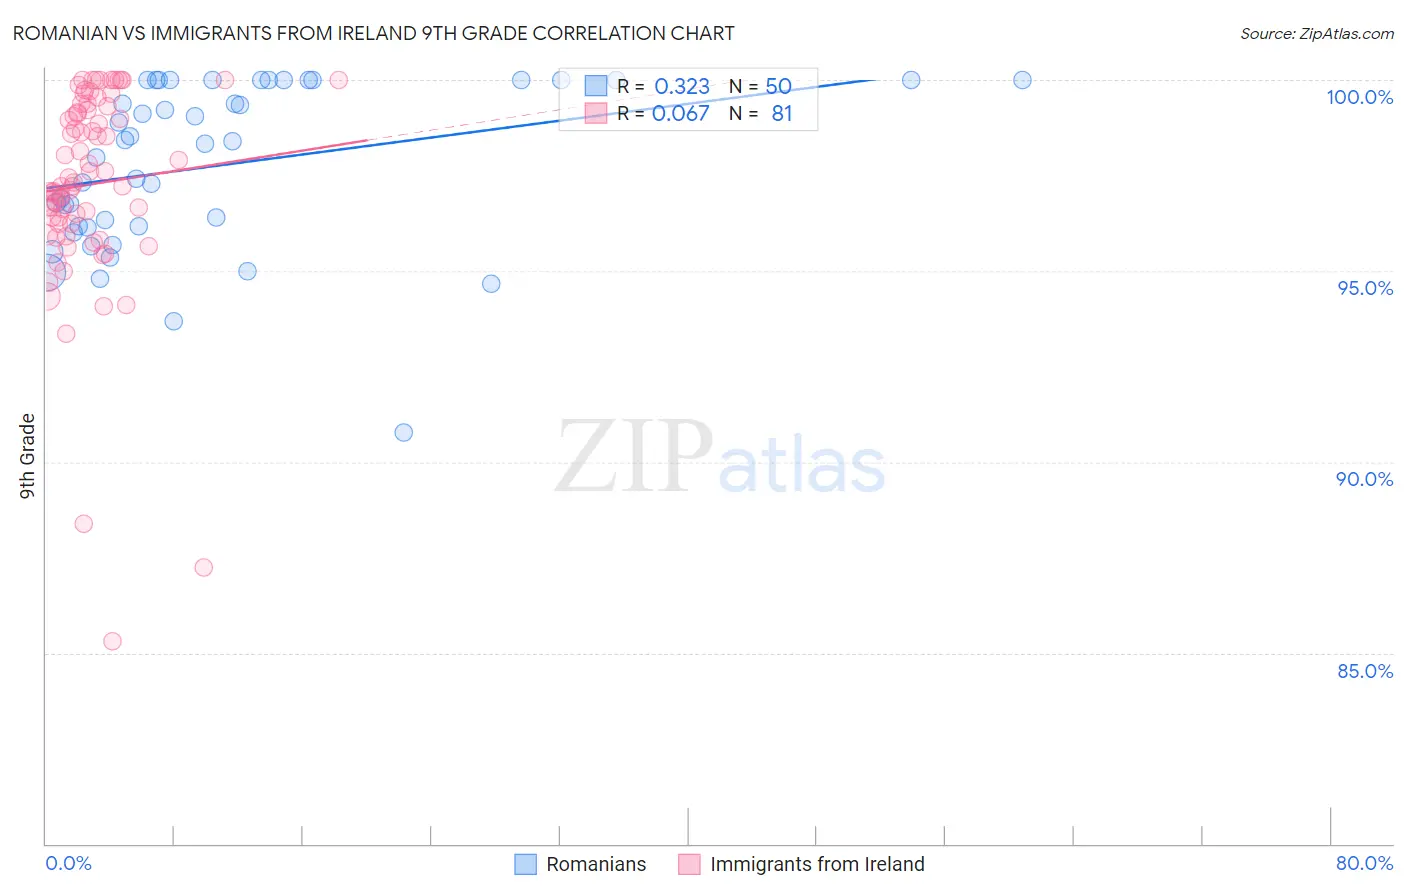
Romanian vs Immigrants from Ireland 9th Grade Correlation Chart

The statistical analysis conducted on geographies consisting of 377,904,438 people shows a mild positive correlation between the proportion of Romanians and percentage of population with at least 9th grade education in the United States with a correlation coefficient (R) of 0.323 and weighted average of 95.7%. Similarly, the statistical analysis conducted on geographies consisting of 240,784,498 people shows a slight positive correlation between the proportion of Immigrants from Ireland and percentage of population with at least 9th grade education in the United States with a correlation coefficient (R) of 0.067 and weighted average of 95.8%, a difference of 0.090%.
Romanian vs Immigrants from Ireland 9th Grade

9th Grade Correlation Summary

MeasurementRomanianImmigrants from Ireland
Minimum90.8%85.3%
Maximum100.0%100.0%
Range9.2%14.7%
Mean97.8%97.3%
Median98.4%97.3%
Interquartile 25% (IQ1)96.2%96.2%
Interquartile 75% (IQ3)100.0%99.3%
Interquartile Range (IQR)3.8%3.0%
Standard Deviation (Sample)2.2%2.7%
Standard Deviation (Population)2.1%2.7%

Demographics Similar to Romanians and Immigrants from Ireland by 9th Grade

In terms of 9th grade, the demographic groups most similar to Romanians are Bhutanese (95.7%, a difference of 0.020%), Arapaho (95.7%, a difference of 0.020%), Puget Sound Salish (95.7%, a difference of 0.020%), White/Caucasian (95.8%, a difference of 0.030%), and Immigrants from South Africa (95.8%, a difference of 0.030%). Similarly, the demographic groups most similar to Immigrants from Ireland are Cypriot (95.8%, a difference of 0.0%), Immigrants from Lithuania (95.8%, a difference of 0.0%), Immigrants from Netherlands (95.8%, a difference of 0.010%), Immigrants from Australia (95.8%, a difference of 0.020%), and Immigrants from Belgium (95.8%, a difference of 0.020%).
DemographicsRating | Rank9th Grade
Canadians
99.7
/100
|
#63
Exceptional
95.9%
Zimbabweans
99.7
/100
|
#64
Exceptional
95.9%
Immigrants | England
99.6
/100
|
#65
Exceptional
95.9%
Immigrants | Netherlands
99.6
/100
|
#66
Exceptional
95.8%
Cypriots
99.6
/100
|
#67
Exceptional
95.8%
Immigrants | Ireland
99.6
/100
|
#68
Exceptional
95.8%
Immigrants | Lithuania
99.6
/100
|
#69
Exceptional
95.8%
Immigrants | Australia
99.5
/100
|
#70
Exceptional
95.8%
Immigrants | Belgium
99.5
/100
|
#71
Exceptional
95.8%
Turks
99.5
/100
|
#72
Exceptional
95.8%
Immigrants | Singapore
99.5
/100
|
#73
Exceptional
95.8%
Thais
99.5
/100
|
#74
Exceptional
95.8%
Inupiat
99.5
/100
|
#75
Exceptional
95.8%
Immigrants | Sweden
99.5
/100
|
#76
Exceptional
95.8%
Whites/Caucasians
99.4
/100
|
#77
Exceptional
95.8%
Immigrants | South Africa
99.4
/100
|
#78
Exceptional
95.8%
Romanians
99.3
/100
|
#79
Exceptional
95.7%
Bhutanese
99.3
/100
|
#80
Exceptional
95.7%
Arapaho
99.3
/100
|
#81
Exceptional
95.7%
Puget Sound Salish
99.2
/100
|
#82
Exceptional
95.7%
Swiss
99.2
/100
|
#83
Exceptional
95.7%