Romanian vs Immigrants from Ethiopia 10th Grade
COMPARE
Romanian
Immigrants from Ethiopia
10th Grade
10th Grade Comparison
Romanians
Immigrants from Ethiopia
94.8%
10TH GRADE
99.5/ 100
METRIC RATING
76th/ 347
METRIC RANK
93.1%
10TH GRADE
5.1/ 100
METRIC RATING
229th/ 347
METRIC RANK
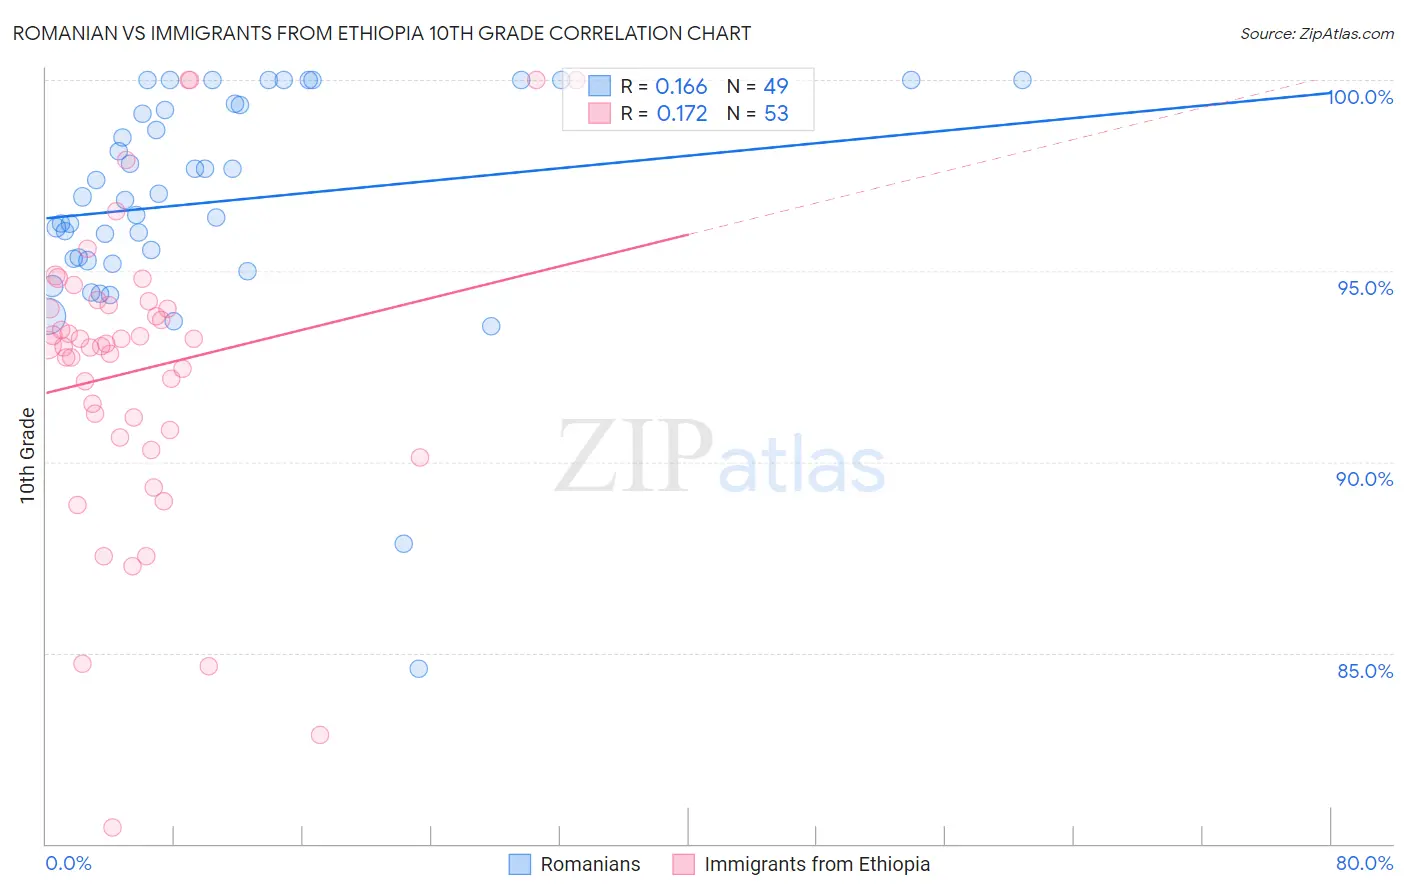
Romanian vs Immigrants from Ethiopia 10th Grade Correlation Chart
The statistical analysis conducted on geographies consisting of 377,905,060 people shows a poor positive correlation between the proportion of Romanians and percentage of population with at least 10th grade education in the United States with a correlation coefficient (R) of 0.166 and weighted average of 94.8%. Similarly, the statistical analysis conducted on geographies consisting of 211,528,629 people shows a poor positive correlation between the proportion of Immigrants from Ethiopia and percentage of population with at least 10th grade education in the United States with a correlation coefficient (R) of 0.172 and weighted average of 93.1%, a difference of 1.8%.
10th Grade Correlation Summary
| Measurement | Romanian | Immigrants from Ethiopia |
| Minimum | 84.6% | 80.4% |
| Maximum | 100.0% | 100.0% |
| Range | 15.4% | 19.6% |
| Mean | 96.8% | 92.4% |
| Median | 96.9% | 93.1% |
| Interquartile 25% (IQ1) | 95.3% | 90.7% |
| Interquartile 75% (IQ3) | 99.4% | 94.2% |
| Interquartile Range (IQR) | 4.1% | 3.4% |
| Standard Deviation (Sample) | 3.1% | 4.0% |
| Standard Deviation (Population) | 3.0% | 3.9% |
Similar Demographics by 10th Grade
Demographics Similar to Romanians by 10th Grade
In terms of 10th grade, the demographic groups most similar to Romanians are Immigrants from South Africa (94.8%, a difference of 0.0%), Okinawan (94.8%, a difference of 0.010%), Bhutanese (94.9%, a difference of 0.040%), Canadian (94.9%, a difference of 0.040%), and Immigrants from Sweden (94.9%, a difference of 0.050%).
| Demographics | Rating | Rank | 10th Grade |
| Immigrants | England | 99.6 /100 | #69 | Exceptional 94.9% |
| Zimbabweans | 99.6 /100 | #70 | Exceptional 94.9% |
| Alaska Natives | 99.6 /100 | #71 | Exceptional 94.9% |
| Immigrants | Sweden | 99.6 /100 | #72 | Exceptional 94.9% |
| Bhutanese | 99.6 /100 | #73 | Exceptional 94.9% |
| Canadians | 99.6 /100 | #74 | Exceptional 94.9% |
| Okinawans | 99.5 /100 | #75 | Exceptional 94.8% |
| Romanians | 99.5 /100 | #76 | Exceptional 94.8% |
| Immigrants | South Africa | 99.5 /100 | #77 | Exceptional 94.8% |
| Filipinos | 99.3 /100 | #78 | Exceptional 94.8% |
| Immigrants | Czechoslovakia | 99.2 /100 | #79 | Exceptional 94.7% |
| Immigrants | Denmark | 99.2 /100 | #80 | Exceptional 94.7% |
| Immigrants | Latvia | 99.2 /100 | #81 | Exceptional 94.7% |
| Swiss | 99.1 /100 | #82 | Exceptional 94.7% |
| Immigrants | Western Europe | 99.1 /100 | #83 | Exceptional 94.7% |
Demographics Similar to Immigrants from Ethiopia by 10th Grade
In terms of 10th grade, the demographic groups most similar to Immigrants from Ethiopia are Immigrants from Africa (93.1%, a difference of 0.0%), South American Indian (93.1%, a difference of 0.010%), Bahamian (93.1%, a difference of 0.010%), Comanche (93.1%, a difference of 0.010%), and Subsaharan African (93.1%, a difference of 0.020%).
| Demographics | Rating | Rank | 10th Grade |
| Ethiopians | 7.9 /100 | #222 | Tragic 93.2% |
| Immigrants | Sierra Leone | 7.6 /100 | #223 | Tragic 93.2% |
| Bolivians | 6.7 /100 | #224 | Tragic 93.2% |
| Somalis | 6.2 /100 | #225 | Tragic 93.2% |
| Koreans | 6.1 /100 | #226 | Tragic 93.2% |
| Blacks/African Americans | 6.0 /100 | #227 | Tragic 93.2% |
| Immigrants | China | 5.9 /100 | #228 | Tragic 93.2% |
| Immigrants | Ethiopia | 5.1 /100 | #229 | Tragic 93.1% |
| Immigrants | Africa | 5.0 /100 | #230 | Tragic 93.1% |
| South American Indians | 4.9 /100 | #231 | Tragic 93.1% |
| Bahamians | 4.9 /100 | #232 | Tragic 93.1% |
| Comanche | 4.9 /100 | #233 | Tragic 93.1% |
| Sub-Saharan Africans | 4.7 /100 | #234 | Tragic 93.1% |
| Africans | 4.6 /100 | #235 | Tragic 93.1% |
| Afghans | 4.5 /100 | #236 | Tragic 93.1% |