Puerto Rican vs Immigrants from Jordan High School Diploma

COMPARE

Puerto Rican
Race
Ancestry
AfghanAfricanAlaska NativeAlaskan AthabascanAlbanianAleutAlsatianAmericanApacheArabArapahoArgentineanArmenianAssyrian/Chaldean/SyriacAustralianAustrianBahamianBangladeshiBarbadianBasqueBelgianBelizeanBermudanBhutaneseBlackfeetBolivianBrazilianBritishBritish West IndianBulgarianBurmeseCajunCambodianCanadianCape VerdeanCarpatho RusynCelticCentral AmericanCentral American IndianCherokeeCheyenneChickasawChileanChineseChippewaChoctawColombianColvilleComancheCosta RicanCreeCreekCroatianCrowCubanCypriotCzechCzechoslovakianDanishDelawareDominicanDutchDutch West IndianEastern EuropeanEcuadorianEgyptianEnglishEstonianEthiopianEuropeanFijianFilipinoFinnishFrenchFrench American IndianFrench CanadianGermanGerman RussianGhanaianGreekGuamanian/ChamorroGuatemalanGuyaneseHaitianHmongHonduranHopiHoumaHungarianIcelanderIndian (Asian)IndonesianInupiatIranianIraqiIrishIroquoisIsraeliItalianJamaicanJapaneseJordanianKenyanKiowaKoreanLaotianLatvianLebaneseLiberianLithuanianLumbeeLuxembourgerMacedonianMalaysianMalteseMarshalleseMenomineeMexicanMexican American IndianMongolianMoroccanNative HawaiianNavajoNepaleseNew ZealanderNicaraguanNigerianNorthern EuropeanNorwegianOkinawanOsageOttawaPaiutePakistaniPalestinianPanamanianParaguayanPennsylvania GermanPeruvianPimaPolishPortuguesePotawatomiPuebloPuerto RicanPuget Sound SalishRomanianRussianSalvadoranSamoanScandinavianScotch-IrishScottishSeminoleSenegaleseSerbianShoshoneSierra LeoneanSiouxSlavicSlovakSloveneSomaliSouth AfricanSouth AmericanSouth American IndianSoviet UnionSpaniardSpanishSpanish AmericanSpanish American IndianSri LankanSubsaharan AfricanSudaneseSwedishSwissSyrianTaiwaneseThaiTlingit-HaidaTohono O'OdhamTonganTrinidadian and TobagonianTsimshianTurkishU.S. Virgin IslanderUgandanUkrainianUruguayanUteVenezuelanVietnameseWelshWest IndianYakamaYaquiYugoslavianYumanYup'ikZimbabwean
Immigration
NonimmigrantsImmigrantsAfghanistanAfricaAlbaniaArgentinaArmeniaAsiaAustraliaAustriaBahamasBangladeshBarbadosBelarusBelgiumBelizeBoliviaBosnia and HerzegovinaBrazilBulgariaBurma/MyanmarCabo VerdeCambodiaCameroonCanadaCaribbeanCentral AmericaChileChinaColombiaCongoCosta RicaCroatiaCubaCzechoslovakiaDenmarkDominicaDominican RepublicEastern AfricaEastern AsiaEastern EuropeEcuadorEgyptEl SalvadorEnglandEritreaEthiopiaEuropeFijiFranceGermanyGhanaGreeceGrenadaGuatemalaGuyanaHaitiHondurasHong KongHungaryIndiaIndonesiaIranIraqIrelandIsraelItalyJamaicaJapanKazakhstanKenyaKoreaKuwaitLaosLatin AmericaLatviaLebanonLiberiaLithuaniaMalaysiaMexicoMicronesiaMiddle AfricaMoldovaMoroccoNepalNetherlandsNicaraguaNigeriaNorth AmericaNorth MacedoniaNorthern AfricaNorthern EuropeNorwayOceaniaPakistanPanamaPeruPhilippinesPolandPortugalRomaniaRussiaSaudi ArabiaScotlandSenegalSerbiaSierra LeoneSingaporeSomaliaSouth AfricaSouth AmericaSouth Central AsiaSouth Eastern AsiaSouthern EuropeSpainSri LankaSt. Vincent and the GrenadinesSudanSwedenSwitzerlandSyriaTaiwanThailandTrinidad and TobagoTurkeyUgandaUkraineUruguayUzbekistanVenezuelaVietnamWest IndiesWestern AfricaWestern AsiaWestern EuropeYemenZaireZimbabweAzores
Immigrants from Jordan
Race
Ancestry
AfghanAfricanAlaska NativeAlaskan AthabascanAlbanianAleutAlsatianAmericanApacheArabArapahoArgentineanArmenianAssyrian/Chaldean/SyriacAustralianAustrianBahamianBangladeshiBarbadianBasqueBelgianBelizeanBermudanBhutaneseBlackfeetBolivianBrazilianBritishBritish West IndianBulgarianBurmeseCajunCambodianCanadianCape VerdeanCarpatho RusynCelticCentral AmericanCentral American IndianCherokeeCheyenneChickasawChileanChineseChippewaChoctawColombianColvilleComancheCosta RicanCreeCreekCroatianCrowCubanCypriotCzechCzechoslovakianDanishDelawareDominicanDutchDutch West IndianEastern EuropeanEcuadorianEgyptianEnglishEstonianEthiopianEuropeanFijianFilipinoFinnishFrenchFrench American IndianFrench CanadianGermanGerman RussianGhanaianGreekGuamanian/ChamorroGuatemalanGuyaneseHaitianHmongHonduranHopiHoumaHungarianIcelanderIndian (Asian)IndonesianInupiatIranianIraqiIrishIroquoisIsraeliItalianJamaicanJapaneseJordanianKenyanKiowaKoreanLaotianLatvianLebaneseLiberianLithuanianLumbeeLuxembourgerMacedonianMalaysianMalteseMarshalleseMenomineeMexicanMexican American IndianMongolianMoroccanNative HawaiianNavajoNepaleseNew ZealanderNicaraguanNigerianNorthern EuropeanNorwegianOkinawanOsageOttawaPaiutePakistaniPalestinianPanamanianParaguayanPennsylvania GermanPeruvianPimaPolishPortuguesePotawatomiPuebloPuget Sound SalishRomanianRussianSalvadoranSamoanScandinavianScotch-IrishScottishSeminoleSenegaleseSerbianShoshoneSierra LeoneanSiouxSlavicSlovakSloveneSomaliSouth AfricanSouth AmericanSouth American IndianSoviet UnionSpaniardSpanishSpanish AmericanSpanish American IndianSri LankanSubsaharan AfricanSudaneseSwedishSwissSyrianTaiwaneseThaiTlingit-HaidaTohono O'OdhamTonganTrinidadian and TobagonianTsimshianTurkishU.S. Virgin IslanderUgandanUkrainianUruguayanUteVenezuelanVietnameseWelshWest IndianYakamaYaquiYugoslavianYumanYup'ikZimbabwean
Immigration
NonimmigrantsImmigrantsAfghanistanAfricaAlbaniaArgentinaArmeniaAsiaAustraliaAustriaBahamasBangladeshBarbadosBelarusBelgiumBelizeBoliviaBosnia and HerzegovinaBrazilBulgariaBurma/MyanmarCabo VerdeCambodiaCameroonCanadaCaribbeanCentral AmericaChileChinaColombiaCongoCosta RicaCroatiaCubaCzechoslovakiaDenmarkDominicaDominican RepublicEastern AfricaEastern AsiaEastern EuropeEcuadorEgyptEl SalvadorEnglandEritreaEthiopiaEuropeFijiFranceGermanyGhanaGreeceGrenadaGuatemalaGuyanaHaitiHondurasHong KongHungaryIndiaIndonesiaIranIraqIrelandIsraelItalyJamaicaJapanJordanKazakhstanKenyaKoreaKuwaitLaosLatin AmericaLatviaLebanonLiberiaLithuaniaMalaysiaMexicoMicronesiaMiddle AfricaMoldovaMoroccoNepalNetherlandsNicaraguaNigeriaNorth AmericaNorth MacedoniaNorthern AfricaNorthern EuropeNorwayOceaniaPakistanPanamaPeruPhilippinesPolandPortugalRomaniaRussiaSaudi ArabiaScotlandSenegalSerbiaSierra LeoneSingaporeSomaliaSouth AfricaSouth AmericaSouth Central AsiaSouth Eastern AsiaSouthern EuropeSpainSri LankaSt. Vincent and the GrenadinesSudanSwedenSwitzerlandSyriaTaiwanThailandTrinidad and TobagoTurkeyUgandaUkraineUruguayUzbekistanVenezuelaVietnamWest IndiesWestern AfricaWestern AsiaWestern EuropeYemenZaireZimbabweAzores
High School Diploma
Income
Poverty
Unemployment
Labor Participation
Family Structure
Vehicle Availability
Education Level
Disability

High School Diploma Comparison

Puerto Ricans

Immigrants from Jordan

Tragic
Excellent
84.7%
HIGH SCHOOL DIPLOMA
0.0/ 100
METRIC RATING
315th/ 347
METRIC RANK
89.8%
HIGH SCHOOL DIPLOMA
87.2/ 100
METRIC RATING
134th/ 347
METRIC RANK

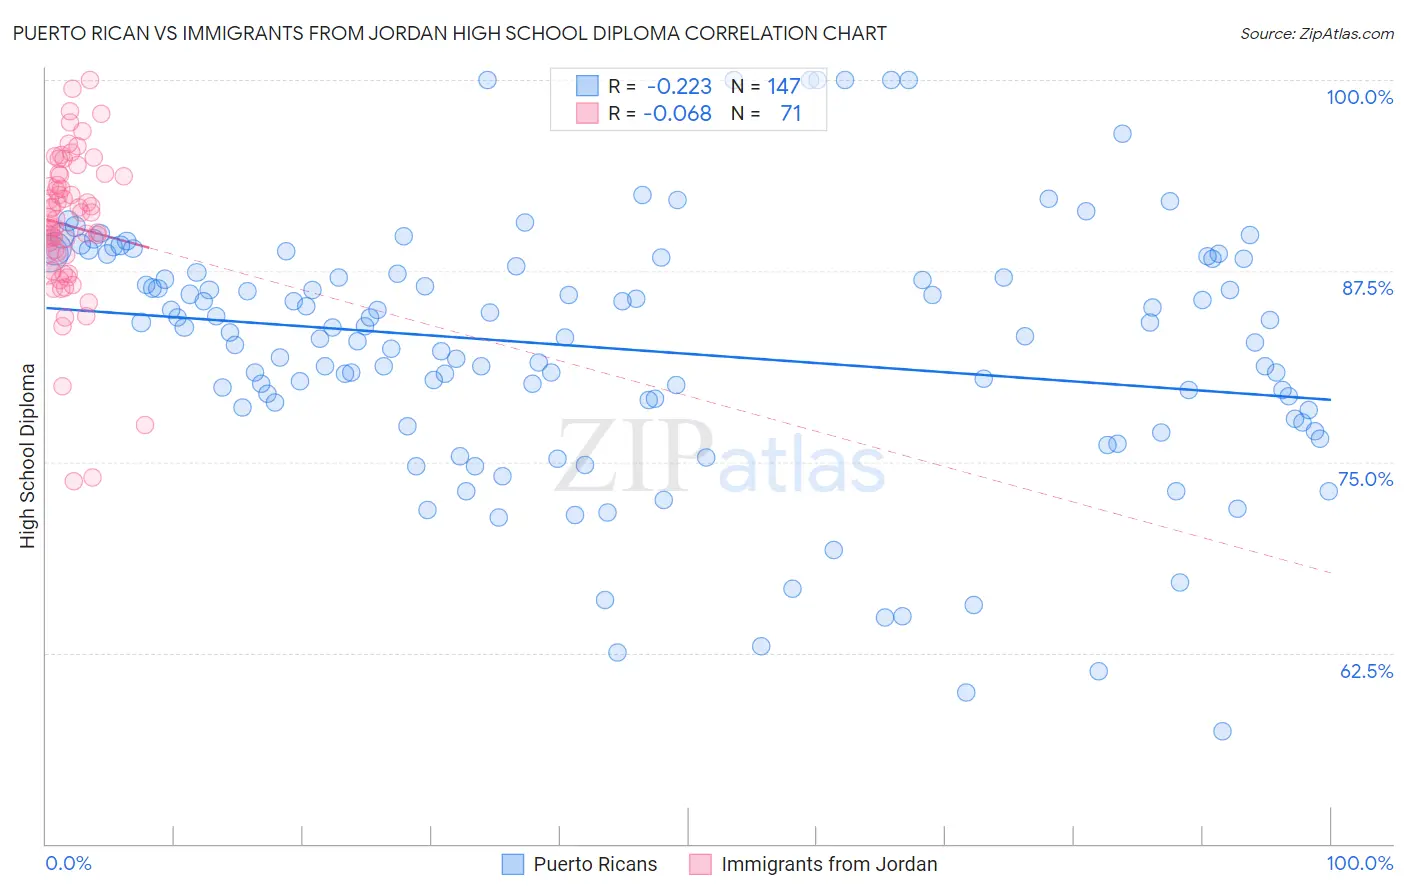
Puerto Rican vs Immigrants from Jordan High School Diploma Correlation Chart

The statistical analysis conducted on geographies consisting of 528,321,094 people shows a weak negative correlation between the proportion of Puerto Ricans and percentage of population with at least high school diploma education in the United States with a correlation coefficient (R) of -0.223 and weighted average of 84.7%. Similarly, the statistical analysis conducted on geographies consisting of 181,278,272 people shows a slight negative correlation between the proportion of Immigrants from Jordan and percentage of population with at least high school diploma education in the United States with a correlation coefficient (R) of -0.068 and weighted average of 89.8%, a difference of 6.0%.
Puerto Rican vs Immigrants from Jordan High School Diploma

High School Diploma Correlation Summary

MeasurementPuerto RicanImmigrants from Jordan
Minimum57.4%73.8%
Maximum100.0%100.0%
Range42.6%26.2%
Mean82.4%90.5%
Median83.5%91.0%
Interquartile 25% (IQ1)78.4%87.5%
Interquartile 75% (IQ3)87.8%93.8%
Interquartile Range (IQR)9.4%6.3%
Standard Deviation (Sample)8.4%5.0%
Standard Deviation (Population)8.4%5.0%

Similar Demographics by High School Diploma

Demographics Similar to Puerto Ricans by High School Diploma

In terms of high school diploma, the demographic groups most similar to Puerto Ricans are Yaqui (84.7%, a difference of 0.10%), Immigrants from Ecuador (84.8%, a difference of 0.20%), Belizean (84.3%, a difference of 0.40%), Cape Verdean (85.1%, a difference of 0.46%), and Immigrants from Caribbean (84.3%, a difference of 0.46%).
DemographicsRating | RankHigh School Diploma
Immigrants | Armenia
0.0
/100
|
#308
Tragic
85.2%
Immigrants | Dominica
0.0
/100
|
#309
Tragic
85.2%
Apache
0.0
/100
|
#310
Tragic
85.1%
Ecuadorians
0.0
/100
|
#311
Tragic
85.1%
Cape Verdeans
0.0
/100
|
#312
Tragic
85.1%
Immigrants | Ecuador
0.0
/100
|
#313
Tragic
84.8%
Yaqui
0.0
/100
|
#314
Tragic
84.7%
Puerto Ricans
0.0
/100
|
#315
Tragic
84.7%
Belizeans
0.0
/100
|
#316
Tragic
84.3%
Immigrants | Caribbean
0.0
/100
|
#317
Tragic
84.3%
Immigrants | Belize
0.0
/100
|
#318
Tragic
84.2%
Central American Indians
0.0
/100
|
#319
Tragic
84.2%
Nicaraguans
0.0
/100
|
#320
Tragic
84.1%
Yuman
0.0
/100
|
#321
Tragic
84.0%
Lumbee
0.0
/100
|
#322
Tragic
83.6%

Demographics Similar to Immigrants from Jordan by High School Diploma

In terms of high school diploma, the demographic groups most similar to Immigrants from Jordan are Immigrants from Bosnia and Herzegovina (89.8%, a difference of 0.0%), Albanian (89.8%, a difference of 0.0%), Immigrants from Italy (89.8%, a difference of 0.010%), Immigrants from Ukraine (89.8%, a difference of 0.020%), and Basque (89.8%, a difference of 0.050%).
DemographicsRating | RankHigh School Diploma
Immigrants | Eastern Asia
89.2
/100
|
#127
Excellent
89.9%
Puget Sound Salish
89.1
/100
|
#128
Excellent
89.9%
Basques
88.5
/100
|
#129
Excellent
89.8%
Immigrants | Ukraine
87.9
/100
|
#130
Excellent
89.8%
Immigrants | Italy
87.4
/100
|
#131
Excellent
89.8%
Immigrants | Bosnia and Herzegovina
87.3
/100
|
#132
Excellent
89.8%
Albanians
87.2
/100
|
#133
Excellent
89.8%
Immigrants | Jordan
87.2
/100
|
#134
Excellent
89.8%
Chippewa
85.6
/100
|
#135
Excellent
89.7%
Ugandans
83.7
/100
|
#136
Excellent
89.7%
Arabs
83.6
/100
|
#137
Excellent
89.7%
Assyrians/Chaldeans/Syriacs
82.5
/100
|
#138
Excellent
89.7%
Kenyans
81.4
/100
|
#139
Excellent
89.6%
Immigrants | Egypt
81.2
/100
|
#140
Excellent
89.6%
Chileans
79.0
/100
|
#141
Good
89.6%