Pueblo vs Argentinean Master's Degree
COMPARE
Pueblo
Argentinean
Master's Degree
Master's Degree Comparison
Pueblo
Argentineans
10.3%
MASTER'S DEGREE
0.0/ 100
METRIC RATING
331st/ 347
METRIC RANK
18.2%
MASTER'S DEGREE
99.9/ 100
METRIC RATING
62nd/ 347
METRIC RANK
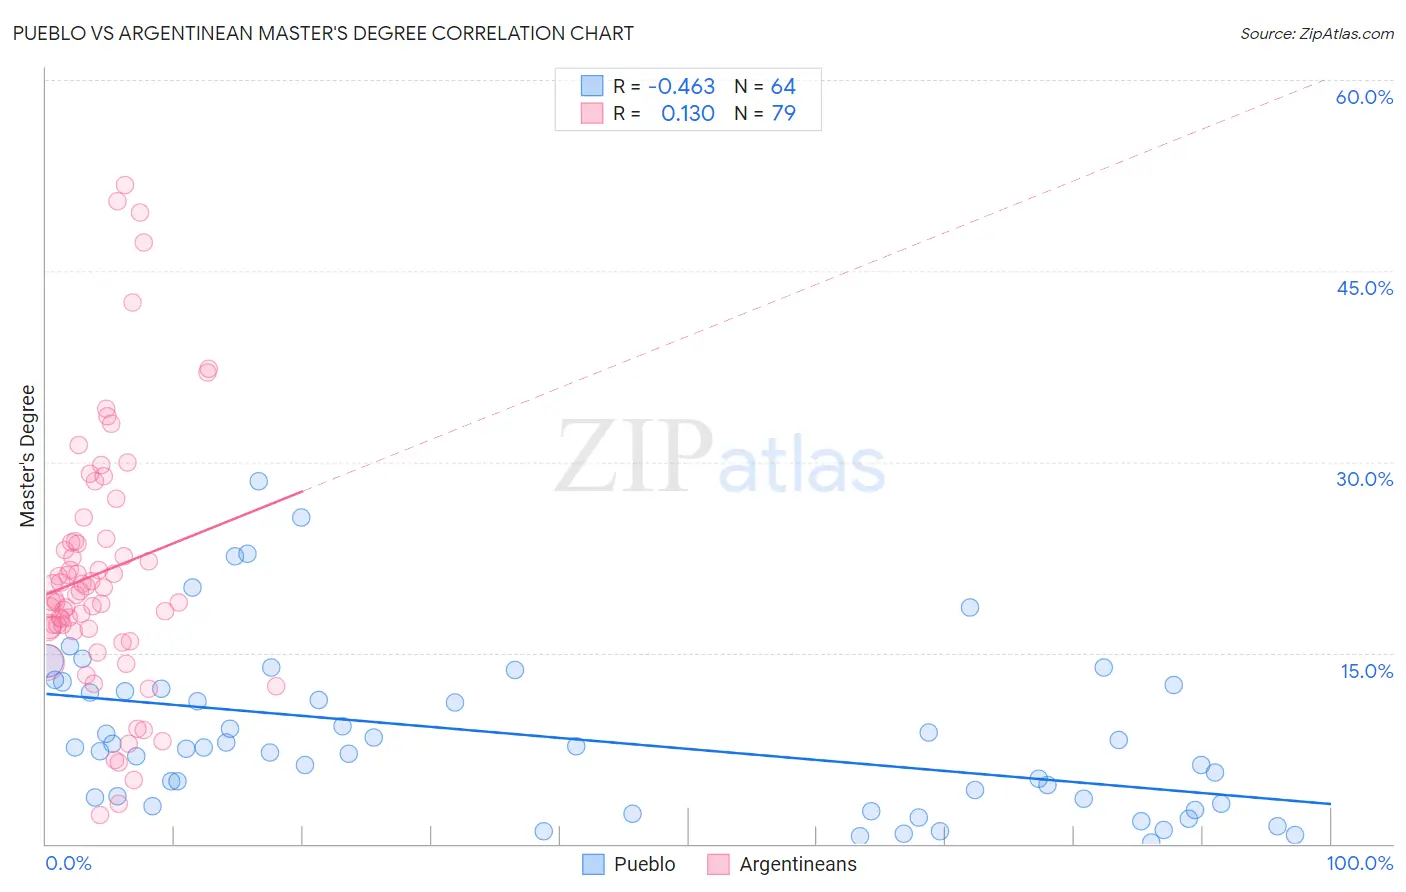
Pueblo vs Argentinean Master's Degree Correlation Chart
The statistical analysis conducted on geographies consisting of 120,067,726 people shows a moderate negative correlation between the proportion of Pueblo and percentage of population with at least master's degree education in the United States with a correlation coefficient (R) of -0.463 and weighted average of 10.3%. Similarly, the statistical analysis conducted on geographies consisting of 297,078,027 people shows a poor positive correlation between the proportion of Argentineans and percentage of population with at least master's degree education in the United States with a correlation coefficient (R) of 0.130 and weighted average of 18.2%, a difference of 76.9%.
Master's Degree Correlation Summary
| Measurement | Pueblo | Argentinean |
| Minimum | 0.12% | 2.2% |
| Maximum | 28.5% | 51.7% |
| Range | 28.3% | 49.5% |
| Mean | 8.4% | 21.3% |
| Median | 7.5% | 19.5% |
| Interquartile 25% (IQ1) | 3.3% | 16.9% |
| Interquartile 75% (IQ3) | 12.1% | 23.8% |
| Interquartile Range (IQR) | 8.8% | 6.9% |
| Standard Deviation (Sample) | 6.4% | 10.1% |
| Standard Deviation (Population) | 6.4% | 10.0% |
Similar Demographics by Master's Degree
Demographics Similar to Pueblo by Master's Degree
In terms of master's degree, the demographic groups most similar to Pueblo are Fijian (10.3%, a difference of 0.16%), Immigrants from the Azores (10.2%, a difference of 0.46%), Menominee (10.2%, a difference of 0.83%), Nepalese (10.5%, a difference of 1.9%), and Bangladeshi (10.5%, a difference of 2.0%).
| Demographics | Rating | Rank | Master's Degree |
| Dutch West Indians | 0.0 /100 | #324 | Tragic 10.6% |
| Inupiat | 0.0 /100 | #325 | Tragic 10.5% |
| Creek | 0.0 /100 | #326 | Tragic 10.5% |
| Paiute | 0.0 /100 | #327 | Tragic 10.5% |
| Bangladeshis | 0.0 /100 | #328 | Tragic 10.5% |
| Nepalese | 0.0 /100 | #329 | Tragic 10.5% |
| Fijians | 0.0 /100 | #330 | Tragic 10.3% |
| Pueblo | 0.0 /100 | #331 | Tragic 10.3% |
| Immigrants | Azores | 0.0 /100 | #332 | Tragic 10.2% |
| Menominee | 0.0 /100 | #333 | Tragic 10.2% |
| Arapaho | 0.0 /100 | #334 | Tragic 10.0% |
| Immigrants | Central America | 0.0 /100 | #335 | Tragic 10.0% |
| Natives/Alaskans | 0.0 /100 | #336 | Tragic 9.9% |
| Mexicans | 0.0 /100 | #337 | Tragic 9.7% |
| Tohono O'odham | 0.0 /100 | #338 | Tragic 9.7% |
Demographics Similar to Argentineans by Master's Degree
In terms of master's degree, the demographic groups most similar to Argentineans are Immigrants from Europe (18.2%, a difference of 0.36%), Immigrants from Netherlands (18.1%, a difference of 0.36%), South African (18.1%, a difference of 0.44%), New Zealander (18.3%, a difference of 0.51%), and Immigrants from Bulgaria (18.3%, a difference of 0.74%).
| Demographics | Rating | Rank | Master's Degree |
| Immigrants | Serbia | 99.9 /100 | #55 | Exceptional 18.5% |
| Asians | 99.9 /100 | #56 | Exceptional 18.4% |
| Immigrants | Asia | 99.9 /100 | #57 | Exceptional 18.4% |
| Australians | 99.9 /100 | #58 | Exceptional 18.4% |
| Immigrants | Bulgaria | 99.9 /100 | #59 | Exceptional 18.3% |
| New Zealanders | 99.9 /100 | #60 | Exceptional 18.3% |
| Immigrants | Europe | 99.9 /100 | #61 | Exceptional 18.2% |
| Argentineans | 99.9 /100 | #62 | Exceptional 18.2% |
| Immigrants | Netherlands | 99.9 /100 | #63 | Exceptional 18.1% |
| South Africans | 99.9 /100 | #64 | Exceptional 18.1% |
| Immigrants | Kazakhstan | 99.8 /100 | #65 | Exceptional 18.0% |
| Ethiopians | 99.8 /100 | #66 | Exceptional 18.0% |
| Immigrants | Argentina | 99.8 /100 | #67 | Exceptional 18.0% |
| Immigrants | Ethiopia | 99.8 /100 | #68 | Exceptional 17.9% |
| Immigrants | Uzbekistan | 99.8 /100 | #69 | Exceptional 17.9% |