Peruvian vs Immigrants from Southern Europe Doctorate Degree

COMPARE

Peruvian
Race
Ancestry
AfghanAfricanAlaska NativeAlaskan AthabascanAlbanianAleutAlsatianAmericanApacheArabArapahoArgentineanArmenianAssyrian/Chaldean/SyriacAustralianAustrianBahamianBangladeshiBarbadianBasqueBelgianBelizeanBermudanBhutaneseBlackfeetBolivianBrazilianBritishBritish West IndianBulgarianBurmeseCajunCambodianCanadianCape VerdeanCarpatho RusynCelticCentral AmericanCentral American IndianCherokeeCheyenneChickasawChileanChineseChippewaChoctawColombianColvilleComancheCosta RicanCreeCreekCroatianCrowCubanCypriotCzechCzechoslovakianDanishDelawareDominicanDutchDutch West IndianEastern EuropeanEcuadorianEgyptianEnglishEstonianEthiopianEuropeanFijianFilipinoFinnishFrenchFrench American IndianFrench CanadianGermanGerman RussianGhanaianGreekGuamanian/ChamorroGuatemalanGuyaneseHaitianHmongHonduranHopiHoumaHungarianIcelanderIndian (Asian)IndonesianInupiatIranianIraqiIrishIroquoisIsraeliItalianJamaicanJapaneseJordanianKenyanKiowaKoreanLaotianLatvianLebaneseLiberianLithuanianLumbeeLuxembourgerMacedonianMalaysianMalteseMarshalleseMenomineeMexicanMexican American IndianMongolianMoroccanNative HawaiianNavajoNepaleseNew ZealanderNicaraguanNigerianNorthern EuropeanNorwegianOkinawanOsageOttawaPaiutePakistaniPalestinianPanamanianParaguayanPennsylvania GermanPeruvianPimaPolishPortuguesePotawatomiPuebloPuerto RicanPuget Sound SalishRomanianRussianSalvadoranSamoanScandinavianScotch-IrishScottishSeminoleSenegaleseSerbianShoshoneSierra LeoneanSiouxSlavicSlovakSloveneSomaliSouth AfricanSouth AmericanSouth American IndianSoviet UnionSpaniardSpanishSpanish AmericanSpanish American IndianSri LankanSubsaharan AfricanSudaneseSwedishSwissSyrianTaiwaneseThaiTlingit-HaidaTohono O'OdhamTonganTrinidadian and TobagonianTsimshianTurkishU.S. Virgin IslanderUgandanUkrainianUruguayanUteVenezuelanVietnameseWelshWest IndianYakamaYaquiYugoslavianYumanYup'ikZimbabwean
Immigration
NonimmigrantsImmigrantsAfghanistanAfricaAlbaniaArgentinaArmeniaAsiaAustraliaAustriaBahamasBangladeshBarbadosBelarusBelgiumBelizeBoliviaBosnia and HerzegovinaBrazilBulgariaBurma/MyanmarCabo VerdeCambodiaCameroonCanadaCaribbeanCentral AmericaChileChinaColombiaCongoCosta RicaCroatiaCubaCzechoslovakiaDenmarkDominicaDominican RepublicEastern AfricaEastern AsiaEastern EuropeEcuadorEgyptEl SalvadorEnglandEritreaEthiopiaEuropeFijiFranceGermanyGhanaGreeceGrenadaGuatemalaGuyanaHaitiHondurasHong KongHungaryIndiaIndonesiaIranIraqIrelandIsraelItalyJamaicaJapanJordanKazakhstanKenyaKoreaKuwaitLaosLatin AmericaLatviaLebanonLiberiaLithuaniaMalaysiaMexicoMicronesiaMiddle AfricaMoldovaMoroccoNepalNetherlandsNicaraguaNigeriaNorth AmericaNorth MacedoniaNorthern AfricaNorthern EuropeNorwayOceaniaPakistanPanamaPeruPhilippinesPolandPortugalRomaniaRussiaSaudi ArabiaScotlandSenegalSerbiaSierra LeoneSingaporeSomaliaSouth AfricaSouth AmericaSouth Central AsiaSouth Eastern AsiaSpainSri LankaSt. Vincent and the GrenadinesSudanSwedenSwitzerlandSyriaTaiwanThailandTrinidad and TobagoTurkeyUgandaUkraineUruguayUzbekistanVenezuelaVietnamWest IndiesWestern AfricaWestern AsiaWestern EuropeYemenZaireZimbabweAzores
Immigrants from Southern Europe
Race
Ancestry
AfghanAfricanAlaska NativeAlaskan AthabascanAlbanianAleutAlsatianAmericanApacheArabArapahoArgentineanArmenianAssyrian/Chaldean/SyriacAustralianAustrianBahamianBangladeshiBarbadianBasqueBelgianBelizeanBermudanBhutaneseBlackfeetBolivianBrazilianBritishBritish West IndianBulgarianBurmeseCajunCambodianCanadianCape VerdeanCarpatho RusynCelticCentral AmericanCentral American IndianCherokeeCheyenneChickasawChileanChineseChippewaChoctawColombianColvilleComancheCosta RicanCreeCreekCroatianCrowCubanCypriotCzechCzechoslovakianDanishDelawareDominicanDutchDutch West IndianEastern EuropeanEcuadorianEgyptianEnglishEstonianEthiopianEuropeanFijianFilipinoFinnishFrenchFrench American IndianFrench CanadianGermanGerman RussianGhanaianGreekGuamanian/ChamorroGuatemalanGuyaneseHaitianHmongHonduranHopiHoumaHungarianIcelanderIndian (Asian)IndonesianInupiatIranianIraqiIrishIroquoisIsraeliItalianJamaicanJapaneseJordanianKenyanKiowaKoreanLaotianLatvianLebaneseLiberianLithuanianLumbeeLuxembourgerMacedonianMalaysianMalteseMarshalleseMenomineeMexicanMexican American IndianMongolianMoroccanNative HawaiianNavajoNepaleseNew ZealanderNicaraguanNigerianNorthern EuropeanNorwegianOkinawanOsageOttawaPaiutePakistaniPalestinianPanamanianParaguayanPennsylvania GermanPimaPolishPortuguesePotawatomiPuebloPuerto RicanPuget Sound SalishRomanianRussianSalvadoranSamoanScandinavianScotch-IrishScottishSeminoleSenegaleseSerbianShoshoneSierra LeoneanSiouxSlavicSlovakSloveneSomaliSouth AfricanSouth AmericanSouth American IndianSoviet UnionSpaniardSpanishSpanish AmericanSpanish American IndianSri LankanSubsaharan AfricanSudaneseSwedishSwissSyrianTaiwaneseThaiTlingit-HaidaTohono O'OdhamTonganTrinidadian and TobagonianTsimshianTurkishU.S. Virgin IslanderUgandanUkrainianUruguayanUteVenezuelanVietnameseWelshWest IndianYakamaYaquiYugoslavianYumanYup'ikZimbabwean
Immigration
NonimmigrantsImmigrantsAfghanistanAfricaAlbaniaArgentinaArmeniaAsiaAustraliaAustriaBahamasBangladeshBarbadosBelarusBelgiumBelizeBoliviaBosnia and HerzegovinaBrazilBulgariaBurma/MyanmarCabo VerdeCambodiaCameroonCanadaCaribbeanCentral AmericaChileChinaColombiaCongoCosta RicaCroatiaCubaCzechoslovakiaDenmarkDominicaDominican RepublicEastern AfricaEastern AsiaEastern EuropeEcuadorEgyptEl SalvadorEnglandEritreaEthiopiaEuropeFijiFranceGermanyGhanaGreeceGrenadaGuatemalaGuyanaHaitiHondurasHong KongHungaryIndiaIndonesiaIranIraqIrelandIsraelItalyJamaicaJapanJordanKazakhstanKenyaKoreaKuwaitLaosLatin AmericaLatviaLebanonLiberiaLithuaniaMalaysiaMexicoMicronesiaMiddle AfricaMoldovaMoroccoNepalNetherlandsNicaraguaNigeriaNorth AmericaNorth MacedoniaNorthern AfricaNorthern EuropeNorwayOceaniaPakistanPanamaPeruPhilippinesPolandPortugalRomaniaRussiaSaudi ArabiaScotlandSenegalSerbiaSierra LeoneSingaporeSomaliaSouth AfricaSouth AmericaSouth Central AsiaSouth Eastern AsiaSouthern EuropeSpainSri LankaSt. Vincent and the GrenadinesSudanSwedenSwitzerlandSyriaTaiwanThailandTrinidad and TobagoTurkeyUgandaUkraineUruguayUzbekistanVenezuelaVietnamWest IndiesWestern AfricaWestern AsiaWestern EuropeYemenZaireZimbabweAzores
Doctorate Degree
Income
Poverty
Unemployment
Labor Participation
Family Structure
Vehicle Availability
Education Level
Disability

Doctorate Degree Comparison

Peruvians

Immigrants from Southern Europe

Fair
Exceptional
1.8%
DOCTORATE DEGREE
34.4/ 100
METRIC RATING
186th/ 347
METRIC RANK
2.0%
DOCTORATE DEGREE
94.7/ 100
METRIC RATING
122nd/ 347
METRIC RANK

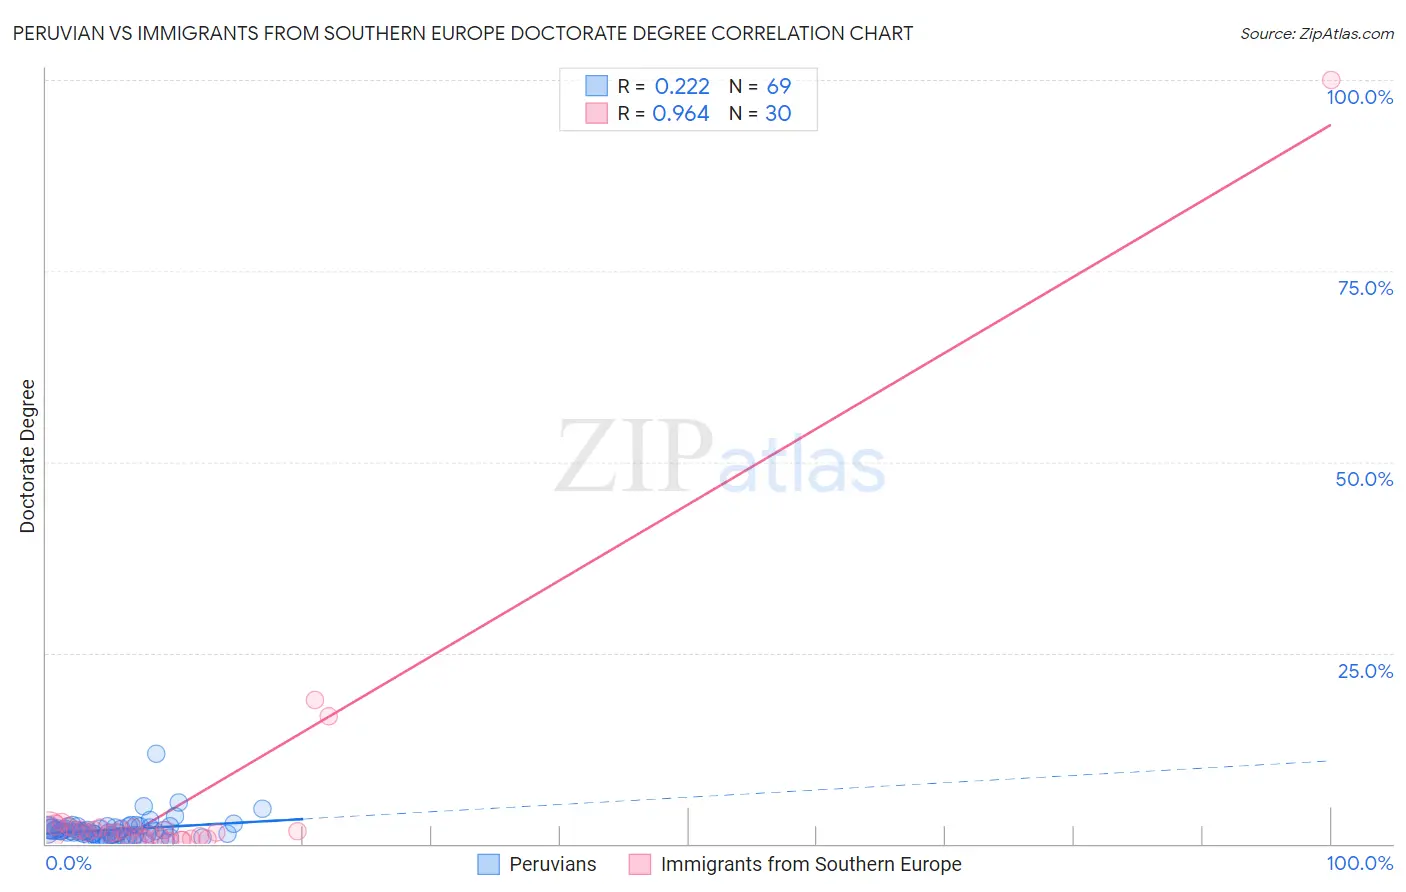
Peruvian vs Immigrants from Southern Europe Doctorate Degree Correlation Chart

The statistical analysis conducted on geographies consisting of 360,973,497 people shows a weak positive correlation between the proportion of Peruvians and percentage of population with at least doctorate degree education in the United States with a correlation coefficient (R) of 0.222 and weighted average of 1.8%. Similarly, the statistical analysis conducted on geographies consisting of 399,415,289 people shows a perfect positive correlation between the proportion of Immigrants from Southern Europe and percentage of population with at least doctorate degree education in the United States with a correlation coefficient (R) of 0.964 and weighted average of 2.0%, a difference of 13.3%.
Peruvian vs Immigrants from Southern Europe Doctorate Degree

Doctorate Degree Correlation Summary

MeasurementPeruvianImmigrants from Southern Europe
Minimum0.17%0.40%
Maximum11.8%100.0%
Range11.6%99.6%
Mean1.8%5.8%
Median1.6%1.5%
Interquartile 25% (IQ1)1.0%1.0%
Interquartile 75% (IQ3)2.1%2.1%
Interquartile Range (IQR)1.1%1.1%
Standard Deviation (Sample)1.6%18.3%
Standard Deviation (Population)1.5%18.0%

Similar Demographics by Doctorate Degree

Demographics Similar to Peruvians by Doctorate Degree

In terms of doctorate degree, the demographic groups most similar to Peruvians are Czechoslovakian (1.8%, a difference of 0.23%), Slovak (1.8%, a difference of 0.32%), German (1.8%, a difference of 0.68%), French Canadian (1.8%, a difference of 0.72%), and Immigrants from Costa Rica (1.8%, a difference of 0.73%).
DemographicsRating | RankDoctorate Degree
Ghanaians
48.3
/100
|
#179
Average
1.8%
Scandinavians
48.0
/100
|
#180
Average
1.8%
Immigrants | Immigrants
46.2
/100
|
#181
Average
1.8%
Immigrants | Afghanistan
44.3
/100
|
#182
Average
1.8%
Finns
42.1
/100
|
#183
Average
1.8%
Nigerians
39.9
/100
|
#184
Fair
1.8%
Slovaks
36.4
/100
|
#185
Fair
1.8%
Peruvians
34.4
/100
|
#186
Fair
1.8%
Czechoslovakians
33.0
/100
|
#187
Fair
1.8%
Germans
30.5
/100
|
#188
Fair
1.8%
French Canadians
30.2
/100
|
#189
Fair
1.8%
Immigrants | Costa Rica
30.2
/100
|
#190
Fair
1.8%
South Americans
29.5
/100
|
#191
Fair
1.8%
Dutch
27.4
/100
|
#192
Fair
1.8%
German Russians
27.1
/100
|
#193
Fair
1.8%

Demographics Similar to Immigrants from Southern Europe by Doctorate Degree

In terms of doctorate degree, the demographic groups most similar to Immigrants from Southern Europe are Immigrants from Jordan (2.0%, a difference of 0.030%), Croatian (2.0%, a difference of 0.46%), Immigrants from Morocco (2.0%, a difference of 0.50%), Pakistani (2.0%, a difference of 0.79%), and Icelander (2.1%, a difference of 0.92%).
DemographicsRating | RankDoctorate Degree
Taiwanese
96.7
/100
|
#115
Exceptional
2.1%
Maltese
96.2
/100
|
#116
Exceptional
2.1%
Lebanese
96.0
/100
|
#117
Exceptional
2.1%
Icelanders
96.0
/100
|
#118
Exceptional
2.1%
Pakistanis
95.8
/100
|
#119
Exceptional
2.0%
Immigrants | Morocco
95.5
/100
|
#120
Exceptional
2.0%
Immigrants | Jordan
94.8
/100
|
#121
Exceptional
2.0%
Immigrants | Southern Europe
94.7
/100
|
#122
Exceptional
2.0%
Croatians
94.0
/100
|
#123
Exceptional
2.0%
Ute
93.2
/100
|
#124
Exceptional
2.0%
Moroccans
93.0
/100
|
#125
Exceptional
2.0%
Jordanians
92.1
/100
|
#126
Exceptional
2.0%
Palestinians
92.0
/100
|
#127
Exceptional
2.0%
Immigrants | Zaire
91.1
/100
|
#128
Exceptional
2.0%
Canadians
90.6
/100
|
#129
Exceptional
2.0%