Pennsylvania German vs Kenyan No Schooling Completed

COMPARE

Pennsylvania German
Race
Ancestry
AfghanAfricanAlaska NativeAlaskan AthabascanAlbanianAleutAlsatianAmericanApacheArabArapahoArgentineanArmenianAssyrian/Chaldean/SyriacAustralianAustrianBahamianBangladeshiBarbadianBasqueBelgianBelizeanBermudanBhutaneseBlackfeetBolivianBrazilianBritishBritish West IndianBulgarianBurmeseCajunCambodianCanadianCape VerdeanCarpatho RusynCelticCentral AmericanCentral American IndianCherokeeCheyenneChickasawChileanChineseChippewaChoctawColombianColvilleComancheCosta RicanCreeCreekCroatianCrowCubanCypriotCzechCzechoslovakianDanishDelawareDominicanDutchDutch West IndianEastern EuropeanEcuadorianEgyptianEnglishEstonianEthiopianEuropeanFijianFilipinoFinnishFrenchFrench American IndianFrench CanadianGermanGerman RussianGhanaianGreekGuamanian/ChamorroGuatemalanGuyaneseHaitianHmongHonduranHopiHoumaHungarianIcelanderIndian (Asian)IndonesianInupiatIranianIraqiIrishIroquoisIsraeliItalianJamaicanJapaneseJordanianKiowaKoreanLaotianLatvianLebaneseLiberianLithuanianLumbeeLuxembourgerMacedonianMalaysianMalteseMarshalleseMenomineeMexicanMexican American IndianMongolianMoroccanNative HawaiianNavajoNepaleseNew ZealanderNicaraguanNigerianNorthern EuropeanNorwegianOkinawanOsageOttawaPaiutePakistaniPalestinianPanamanianParaguayanPennsylvania GermanPeruvianPimaPolishPortuguesePotawatomiPuebloPuerto RicanPuget Sound SalishRomanianRussianSalvadoranSamoanScandinavianScotch-IrishScottishSeminoleSenegaleseSerbianShoshoneSierra LeoneanSiouxSlavicSlovakSloveneSomaliSouth AfricanSouth AmericanSouth American IndianSoviet UnionSpaniardSpanishSpanish AmericanSpanish American IndianSri LankanSubsaharan AfricanSudaneseSwedishSwissSyrianTaiwaneseThaiTlingit-HaidaTohono O'OdhamTonganTrinidadian and TobagonianTsimshianTurkishU.S. Virgin IslanderUgandanUkrainianUruguayanUteVenezuelanVietnameseWelshWest IndianYakamaYaquiYugoslavianYumanYup'ikZimbabwean
Immigration
NonimmigrantsImmigrantsAfghanistanAfricaAlbaniaArgentinaArmeniaAsiaAustraliaAustriaBahamasBangladeshBarbadosBelarusBelgiumBelizeBoliviaBosnia and HerzegovinaBrazilBulgariaBurma/MyanmarCabo VerdeCambodiaCameroonCanadaCaribbeanCentral AmericaChileChinaColombiaCongoCosta RicaCroatiaCubaCzechoslovakiaDenmarkDominicaDominican RepublicEastern AfricaEastern AsiaEastern EuropeEcuadorEgyptEl SalvadorEnglandEritreaEthiopiaEuropeFijiFranceGermanyGhanaGreeceGrenadaGuatemalaGuyanaHaitiHondurasHong KongHungaryIndiaIndonesiaIranIraqIrelandIsraelItalyJamaicaJapanJordanKazakhstanKenyaKoreaKuwaitLaosLatin AmericaLatviaLebanonLiberiaLithuaniaMalaysiaMexicoMicronesiaMiddle AfricaMoldovaMoroccoNepalNetherlandsNicaraguaNigeriaNorth AmericaNorth MacedoniaNorthern AfricaNorthern EuropeNorwayOceaniaPakistanPanamaPeruPhilippinesPolandPortugalRomaniaRussiaSaudi ArabiaScotlandSenegalSerbiaSierra LeoneSingaporeSomaliaSouth AfricaSouth AmericaSouth Central AsiaSouth Eastern AsiaSouthern EuropeSpainSri LankaSt. Vincent and the GrenadinesSudanSwedenSwitzerlandSyriaTaiwanThailandTrinidad and TobagoTurkeyUgandaUkraineUruguayUzbekistanVenezuelaVietnamWest IndiesWestern AfricaWestern AsiaWestern EuropeYemenZaireZimbabweAzores
Kenyan
Race
Ancestry
AfghanAfricanAlaska NativeAlaskan AthabascanAlbanianAleutAlsatianAmericanApacheArabArapahoArgentineanArmenianAssyrian/Chaldean/SyriacAustralianAustrianBahamianBangladeshiBarbadianBasqueBelgianBelizeanBermudanBhutaneseBlackfeetBolivianBrazilianBritishBritish West IndianBulgarianBurmeseCajunCambodianCanadianCape VerdeanCarpatho RusynCelticCentral AmericanCentral American IndianCherokeeCheyenneChickasawChileanChineseChippewaChoctawColombianColvilleComancheCosta RicanCreeCreekCroatianCrowCubanCypriotCzechCzechoslovakianDanishDelawareDominicanDutchDutch West IndianEastern EuropeanEcuadorianEgyptianEnglishEstonianEthiopianEuropeanFijianFilipinoFinnishFrenchFrench American IndianFrench CanadianGermanGerman RussianGhanaianGreekGuamanian/ChamorroGuatemalanGuyaneseHaitianHmongHonduranHopiHoumaHungarianIcelanderIndian (Asian)IndonesianInupiatIranianIraqiIrishIroquoisIsraeliItalianJamaicanJapaneseJordanianKenyanKiowaKoreanLaotianLatvianLebaneseLiberianLithuanianLumbeeLuxembourgerMacedonianMalaysianMalteseMarshalleseMenomineeMexicanMexican American IndianMongolianMoroccanNative HawaiianNavajoNepaleseNew ZealanderNicaraguanNigerianNorthern EuropeanNorwegianOkinawanOsageOttawaPaiutePakistaniPalestinianPanamanianParaguayanPeruvianPimaPolishPortuguesePotawatomiPuebloPuerto RicanPuget Sound SalishRomanianRussianSalvadoranSamoanScandinavianScotch-IrishScottishSeminoleSenegaleseSerbianShoshoneSierra LeoneanSiouxSlavicSlovakSloveneSomaliSouth AfricanSouth AmericanSouth American IndianSoviet UnionSpaniardSpanishSpanish AmericanSpanish American IndianSri LankanSubsaharan AfricanSudaneseSwedishSwissSyrianTaiwaneseThaiTlingit-HaidaTohono O'OdhamTonganTrinidadian and TobagonianTsimshianTurkishU.S. Virgin IslanderUgandanUkrainianUruguayanUteVenezuelanVietnameseWelshWest IndianYakamaYaquiYugoslavianYumanYup'ikZimbabwean
Immigration
NonimmigrantsImmigrantsAfghanistanAfricaAlbaniaArgentinaArmeniaAsiaAustraliaAustriaBahamasBangladeshBarbadosBelarusBelgiumBelizeBoliviaBosnia and HerzegovinaBrazilBulgariaBurma/MyanmarCabo VerdeCambodiaCameroonCanadaCaribbeanCentral AmericaChileChinaColombiaCongoCosta RicaCroatiaCubaCzechoslovakiaDenmarkDominicaDominican RepublicEastern AfricaEastern AsiaEastern EuropeEcuadorEgyptEl SalvadorEnglandEritreaEthiopiaEuropeFijiFranceGermanyGhanaGreeceGrenadaGuatemalaGuyanaHaitiHondurasHong KongHungaryIndiaIndonesiaIranIraqIrelandIsraelItalyJamaicaJapanJordanKazakhstanKenyaKoreaKuwaitLaosLatin AmericaLatviaLebanonLiberiaLithuaniaMalaysiaMexicoMicronesiaMiddle AfricaMoldovaMoroccoNepalNetherlandsNicaraguaNigeriaNorth AmericaNorth MacedoniaNorthern AfricaNorthern EuropeNorwayOceaniaPakistanPanamaPeruPhilippinesPolandPortugalRomaniaRussiaSaudi ArabiaScotlandSenegalSerbiaSierra LeoneSingaporeSomaliaSouth AfricaSouth AmericaSouth Central AsiaSouth Eastern AsiaSouthern EuropeSpainSri LankaSt. Vincent and the GrenadinesSudanSwedenSwitzerlandSyriaTaiwanThailandTrinidad and TobagoTurkeyUgandaUkraineUruguayUzbekistanVenezuelaVietnamWest IndiesWestern AfricaWestern AsiaWestern EuropeYemenZaireZimbabweAzores
No Schooling Completed
Income
Poverty
Unemployment
Labor Participation
Family Structure
Vehicle Availability
Education Level
Disability

No Schooling Completed Comparison

Pennsylvania Germans

Kenyans

Exceptional
Good
1.5%
NO SCHOOLING COMPLETED
100.0/ 100
METRIC RATING
24th/ 347
METRIC RANK
2.0%
NO SCHOOLING COMPLETED
65.7/ 100
METRIC RATING
160th/ 347
METRIC RANK

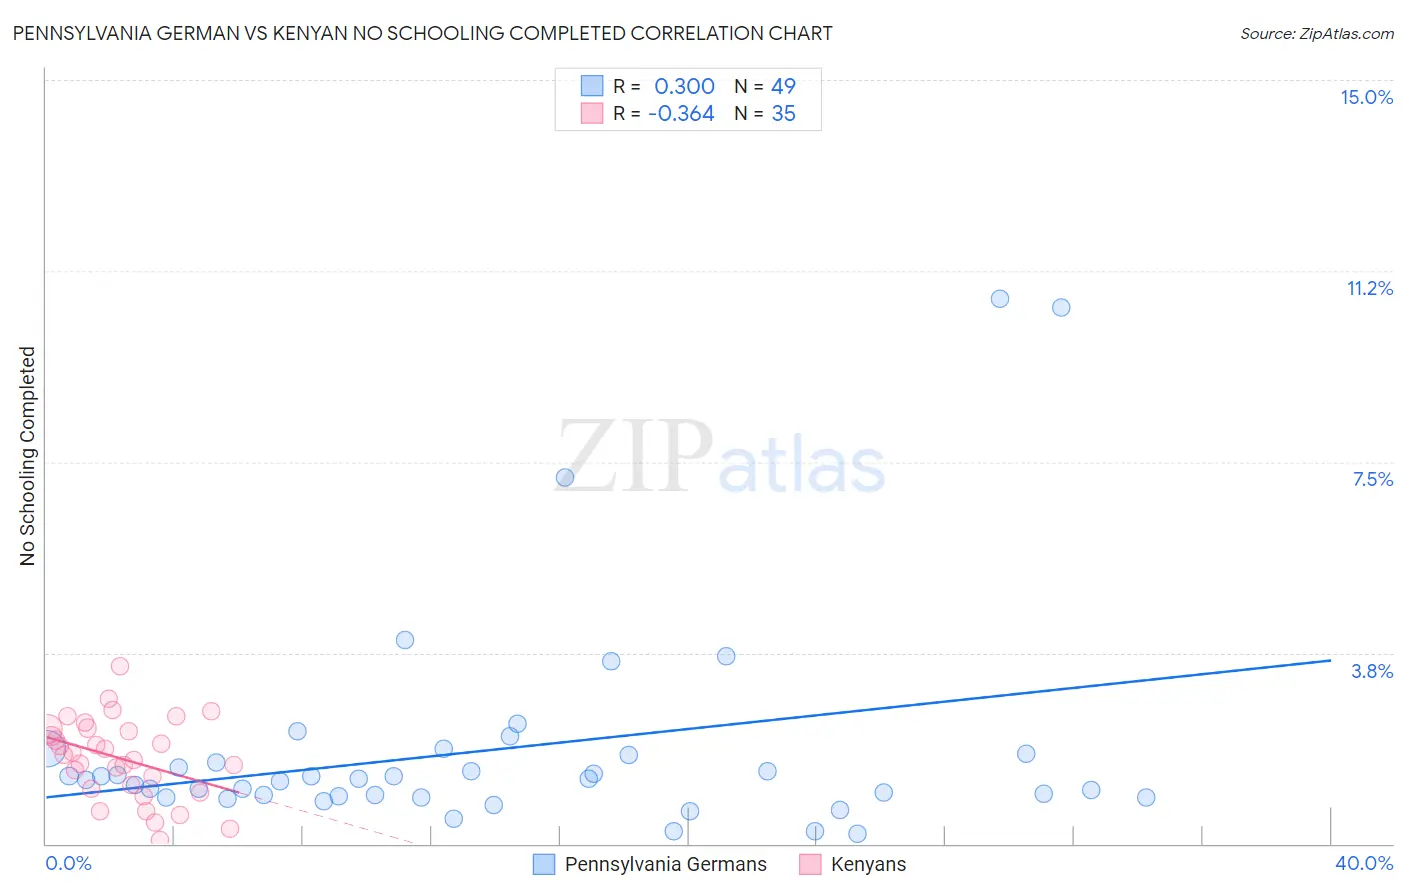
Pennsylvania German vs Kenyan No Schooling Completed Correlation Chart

The statistical analysis conducted on geographies consisting of 231,584,755 people shows a mild positive correlation between the proportion of Pennsylvania Germans and percentage of population with no schooling in the United States with a correlation coefficient (R) of 0.300 and weighted average of 1.5%. Similarly, the statistical analysis conducted on geographies consisting of 167,616,465 people shows a mild negative correlation between the proportion of Kenyans and percentage of population with no schooling in the United States with a correlation coefficient (R) of -0.364 and weighted average of 2.0%, a difference of 37.9%.
Pennsylvania German vs Kenyan No Schooling Completed

No Schooling Completed Correlation Summary

MeasurementPennsylvania GermanKenyan
Minimum0.19%0.067%
Maximum10.7%3.5%
Range10.5%3.4%
Mean1.8%1.7%
Median1.3%1.8%
Interquartile 25% (IQ1)0.92%1.1%
Interquartile 75% (IQ3)1.8%2.3%
Interquartile Range (IQR)0.83%1.2%
Standard Deviation (Sample)2.2%0.79%
Standard Deviation (Population)2.1%0.78%

Similar Demographics by No Schooling Completed

Demographics Similar to Pennsylvania Germans by No Schooling Completed

In terms of no schooling completed, the demographic groups most similar to Pennsylvania Germans are French (1.5%, a difference of 0.020%), European (1.5%, a difference of 0.35%), Alaska Native (1.5%, a difference of 0.61%), Czech (1.5%, a difference of 0.61%), and Chinese (1.5%, a difference of 0.70%).
DemographicsRating | RankNo Schooling Completed
Croatians
100.0
/100
|
#17
Exceptional
1.5%
Danes
100.0
/100
|
#18
Exceptional
1.5%
Alaskan Athabascans
100.0
/100
|
#19
Exceptional
1.5%
Welsh
100.0
/100
|
#20
Exceptional
1.5%
Chinese
100.0
/100
|
#21
Exceptional
1.5%
Alaska Natives
100.0
/100
|
#22
Exceptional
1.5%
Europeans
100.0
/100
|
#23
Exceptional
1.5%
Pennsylvania Germans
100.0
/100
|
#24
Exceptional
1.5%
French
100.0
/100
|
#25
Exceptional
1.5%
Czechs
100.0
/100
|
#26
Exceptional
1.5%
Scandinavians
100.0
/100
|
#27
Exceptional
1.5%
French Canadians
100.0
/100
|
#28
Exceptional
1.5%
Lumbee
100.0
/100
|
#29
Exceptional
1.5%
British
100.0
/100
|
#30
Exceptional
1.5%
Inupiat
100.0
/100
|
#31
Exceptional
1.5%

Demographics Similar to Kenyans by No Schooling Completed

In terms of no schooling completed, the demographic groups most similar to Kenyans are Immigrants from Spain (2.0%, a difference of 0.12%), Immigrants from Korea (2.0%, a difference of 0.16%), Ugandan (2.0%, a difference of 0.17%), Immigrants from Sri Lanka (2.0%, a difference of 0.20%), and Chilean (2.0%, a difference of 0.24%).
DemographicsRating | RankNo Schooling Completed
Immigrants | Italy
68.9
/100
|
#153
Good
2.0%
Immigrants | Venezuela
68.5
/100
|
#154
Good
2.0%
Immigrants | Russia
67.6
/100
|
#155
Good
2.0%
Chileans
67.2
/100
|
#156
Good
2.0%
Immigrants | Sri Lanka
67.0
/100
|
#157
Good
2.0%
Immigrants | Korea
66.7
/100
|
#158
Good
2.0%
Immigrants | Spain
66.4
/100
|
#159
Good
2.0%
Kenyans
65.7
/100
|
#160
Good
2.0%
Ugandans
64.6
/100
|
#161
Good
2.0%
Immigrants | Brazil
63.8
/100
|
#162
Good
2.1%
Albanians
62.2
/100
|
#163
Good
2.1%
Comanche
60.7
/100
|
#164
Good
2.1%
Brazilians
60.2
/100
|
#165
Good
2.1%
Dutch West Indians
59.9
/100
|
#166
Average
2.1%
Egyptians
59.2
/100
|
#167
Average
2.1%