Pennsylvania German vs Crow High School Diploma
COMPARE
Pennsylvania German
Crow
High School Diploma
High School Diploma Comparison
Pennsylvania Germans
Crow
87.0%
HIGH SCHOOL DIPLOMA
0.2/ 100
METRIC RATING
268th/ 347
METRIC RANK
88.4%
HIGH SCHOOL DIPLOMA
10.9/ 100
METRIC RATING
215th/ 347
METRIC RANK
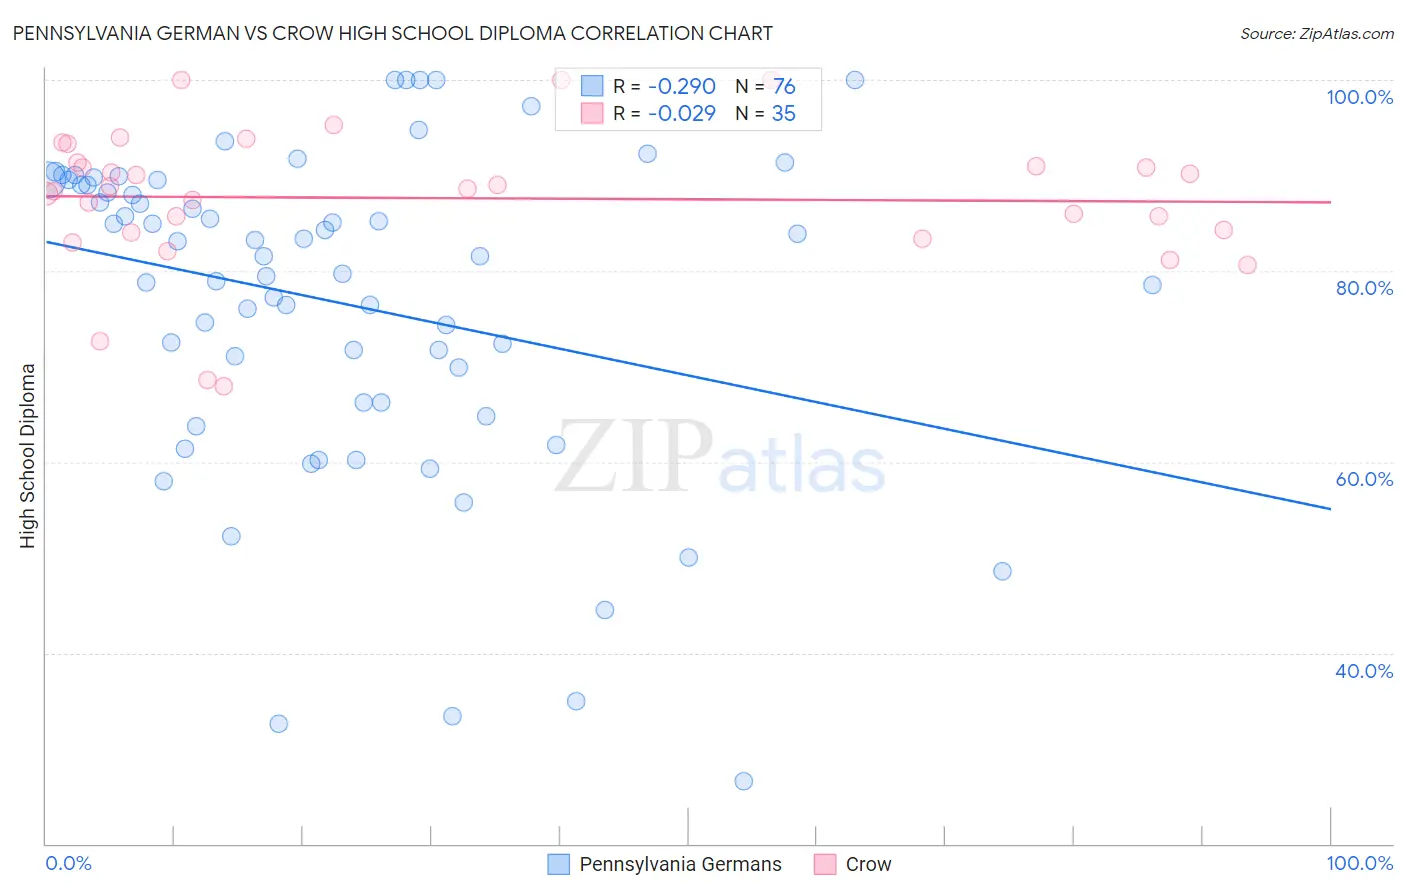
Pennsylvania German vs Crow High School Diploma Correlation Chart
The statistical analysis conducted on geographies consisting of 234,102,935 people shows a weak negative correlation between the proportion of Pennsylvania Germans and percentage of population with at least high school diploma education in the United States with a correlation coefficient (R) of -0.290 and weighted average of 87.0%. Similarly, the statistical analysis conducted on geographies consisting of 59,209,940 people shows no correlation between the proportion of Crow and percentage of population with at least high school diploma education in the United States with a correlation coefficient (R) of -0.029 and weighted average of 88.4%, a difference of 1.7%.
High School Diploma Correlation Summary
| Measurement | Pennsylvania German | Crow |
| Minimum | 26.6% | 67.9% |
| Maximum | 100.0% | 100.0% |
| Range | 73.4% | 32.1% |
| Mean | 76.7% | 87.6% |
| Median | 81.5% | 88.6% |
| Interquartile 25% (IQ1) | 66.2% | 84.0% |
| Interquartile 75% (IQ3) | 89.3% | 91.4% |
| Interquartile Range (IQR) | 23.1% | 7.4% |
| Standard Deviation (Sample) | 17.0% | 7.5% |
| Standard Deviation (Population) | 16.9% | 7.4% |
Similar Demographics by High School Diploma
Demographics Similar to Pennsylvania Germans by High School Diploma
In terms of high school diploma, the demographic groups most similar to Pennsylvania Germans are Sri Lankan (87.0%, a difference of 0.010%), Malaysian (87.0%, a difference of 0.020%), Black/African American (87.0%, a difference of 0.030%), Immigrants from Congo (87.0%, a difference of 0.050%), and West Indian (86.9%, a difference of 0.090%).
| Demographics | Rating | Rank | High School Diploma |
| Seminole | 0.4 /100 | #261 | Tragic 87.3% |
| Immigrants | Peru | 0.4 /100 | #262 | Tragic 87.3% |
| Immigrants | South Eastern Asia | 0.3 /100 | #263 | Tragic 87.2% |
| Jamaicans | 0.3 /100 | #264 | Tragic 87.2% |
| U.S. Virgin Islanders | 0.2 /100 | #265 | Tragic 87.1% |
| Immigrants | Congo | 0.2 /100 | #266 | Tragic 87.0% |
| Blacks/African Americans | 0.2 /100 | #267 | Tragic 87.0% |
| Pennsylvania Germans | 0.2 /100 | #268 | Tragic 87.0% |
| Sri Lankans | 0.2 /100 | #269 | Tragic 87.0% |
| Malaysians | 0.2 /100 | #270 | Tragic 87.0% |
| West Indians | 0.1 /100 | #271 | Tragic 86.9% |
| Trinidadians and Tobagonians | 0.1 /100 | #272 | Tragic 86.9% |
| Immigrants | Jamaica | 0.1 /100 | #273 | Tragic 86.9% |
| Bangladeshis | 0.1 /100 | #274 | Tragic 86.9% |
| Immigrants | Trinidad and Tobago | 0.1 /100 | #275 | Tragic 86.8% |
Demographics Similar to Crow by High School Diploma
In terms of high school diploma, the demographic groups most similar to Crow are Immigrants from Cameroon (88.4%, a difference of 0.0%), Chickasaw (88.4%, a difference of 0.010%), Immigrants from Africa (88.4%, a difference of 0.010%), Immigrants from Somalia (88.4%, a difference of 0.020%), and Immigrants from Bolivia (88.4%, a difference of 0.020%).
| Demographics | Rating | Rank | High School Diploma |
| Portuguese | 14.4 /100 | #208 | Poor 88.5% |
| Cherokee | 14.3 /100 | #209 | Poor 88.5% |
| Samoans | 14.0 /100 | #210 | Poor 88.5% |
| Inupiat | 13.1 /100 | #211 | Poor 88.5% |
| South American Indians | 12.2 /100 | #212 | Poor 88.5% |
| Immigrants | Somalia | 11.3 /100 | #213 | Poor 88.4% |
| Immigrants | Cameroon | 10.9 /100 | #214 | Poor 88.4% |
| Crow | 10.9 /100 | #215 | Poor 88.4% |
| Chickasaw | 10.7 /100 | #216 | Poor 88.4% |
| Immigrants | Africa | 10.6 /100 | #217 | Poor 88.4% |
| Immigrants | Bolivia | 10.3 /100 | #218 | Poor 88.4% |
| Costa Ricans | 9.6 /100 | #219 | Tragic 88.4% |
| Tongans | 9.5 /100 | #220 | Tragic 88.4% |
| Immigrants | Afghanistan | 8.6 /100 | #221 | Tragic 88.3% |
| Colville | 7.8 /100 | #222 | Tragic 88.3% |