Pennsylvania German vs Argentinean 11th Grade

COMPARE

Pennsylvania German
Race
Ancestry
AfghanAfricanAlaska NativeAlaskan AthabascanAlbanianAleutAlsatianAmericanApacheArabArapahoArmenianAssyrian/Chaldean/SyriacAustralianAustrianBahamianBangladeshiBarbadianBasqueBelgianBelizeanBermudanBhutaneseBlackfeetBolivianBrazilianBritishBritish West IndianBulgarianBurmeseCajunCambodianCanadianCape VerdeanCarpatho RusynCelticCentral AmericanCentral American IndianCherokeeCheyenneChickasawChileanChineseChippewaChoctawColombianColvilleComancheCosta RicanCreeCreekCroatianCrowCubanCypriotCzechCzechoslovakianDanishDelawareDominicanDutchDutch West IndianEastern EuropeanEcuadorianEgyptianEnglishEstonianEthiopianEuropeanFijianFilipinoFinnishFrenchFrench American IndianFrench CanadianGermanGerman RussianGhanaianGreekGuamanian/ChamorroGuatemalanGuyaneseHaitianHmongHonduranHopiHoumaHungarianIcelanderIndian (Asian)IndonesianInupiatIranianIraqiIrishIroquoisIsraeliItalianJamaicanJapaneseJordanianKenyanKiowaKoreanLaotianLatvianLebaneseLiberianLithuanianLumbeeLuxembourgerMacedonianMalaysianMalteseMarshalleseMenomineeMexicanMexican American IndianMongolianMoroccanNative HawaiianNavajoNepaleseNew ZealanderNicaraguanNigerianNorthern EuropeanNorwegianOkinawanOsageOttawaPaiutePakistaniPalestinianPanamanianParaguayanPennsylvania GermanPeruvianPimaPolishPortuguesePotawatomiPuebloPuerto RicanPuget Sound SalishRomanianRussianSalvadoranSamoanScandinavianScotch-IrishScottishSeminoleSenegaleseSerbianShoshoneSierra LeoneanSiouxSlavicSlovakSloveneSomaliSouth AfricanSouth AmericanSouth American IndianSoviet UnionSpaniardSpanishSpanish AmericanSpanish American IndianSri LankanSubsaharan AfricanSudaneseSwedishSwissSyrianTaiwaneseThaiTlingit-HaidaTohono O'OdhamTonganTrinidadian and TobagonianTsimshianTurkishU.S. Virgin IslanderUgandanUkrainianUruguayanUteVenezuelanVietnameseWelshWest IndianYakamaYaquiYugoslavianYumanYup'ikZimbabwean
Immigration
NonimmigrantsImmigrantsAfghanistanAfricaAlbaniaArgentinaArmeniaAsiaAustraliaAustriaBahamasBangladeshBarbadosBelarusBelgiumBelizeBoliviaBosnia and HerzegovinaBrazilBulgariaBurma/MyanmarCabo VerdeCambodiaCameroonCanadaCaribbeanCentral AmericaChileChinaColombiaCongoCosta RicaCroatiaCubaCzechoslovakiaDenmarkDominicaDominican RepublicEastern AfricaEastern AsiaEastern EuropeEcuadorEgyptEl SalvadorEnglandEritreaEthiopiaEuropeFijiFranceGermanyGhanaGreeceGrenadaGuatemalaGuyanaHaitiHondurasHong KongHungaryIndiaIndonesiaIranIraqIrelandIsraelItalyJamaicaJapanJordanKazakhstanKenyaKoreaKuwaitLaosLatin AmericaLatviaLebanonLiberiaLithuaniaMalaysiaMexicoMicronesiaMiddle AfricaMoldovaMoroccoNepalNetherlandsNicaraguaNigeriaNorth AmericaNorth MacedoniaNorthern AfricaNorthern EuropeNorwayOceaniaPakistanPanamaPeruPhilippinesPolandPortugalRomaniaRussiaSaudi ArabiaScotlandSenegalSerbiaSierra LeoneSingaporeSomaliaSouth AfricaSouth AmericaSouth Central AsiaSouth Eastern AsiaSouthern EuropeSpainSri LankaSt. Vincent and the GrenadinesSudanSwedenSwitzerlandSyriaTaiwanThailandTrinidad and TobagoTurkeyUgandaUkraineUruguayUzbekistanVenezuelaVietnamWest IndiesWestern AfricaWestern AsiaWestern EuropeYemenZaireZimbabweAzores
Argentinean
Race
Ancestry
AfghanAfricanAlaska NativeAlaskan AthabascanAlbanianAleutAlsatianAmericanApacheArabArapahoArgentineanArmenianAssyrian/Chaldean/SyriacAustralianAustrianBahamianBangladeshiBarbadianBasqueBelgianBelizeanBermudanBhutaneseBlackfeetBolivianBrazilianBritishBritish West IndianBulgarianBurmeseCajunCambodianCanadianCape VerdeanCarpatho RusynCelticCentral AmericanCentral American IndianCherokeeCheyenneChickasawChileanChineseChippewaChoctawColombianColvilleComancheCosta RicanCreeCreekCroatianCrowCubanCypriotCzechCzechoslovakianDanishDelawareDominicanDutchDutch West IndianEastern EuropeanEcuadorianEgyptianEnglishEstonianEthiopianEuropeanFijianFilipinoFinnishFrenchFrench American IndianFrench CanadianGermanGerman RussianGhanaianGreekGuamanian/ChamorroGuatemalanGuyaneseHaitianHmongHonduranHopiHoumaHungarianIcelanderIndian (Asian)IndonesianInupiatIranianIraqiIrishIroquoisIsraeliItalianJamaicanJapaneseJordanianKenyanKiowaKoreanLaotianLatvianLebaneseLiberianLithuanianLumbeeLuxembourgerMacedonianMalaysianMalteseMarshalleseMenomineeMexicanMexican American IndianMongolianMoroccanNative HawaiianNavajoNepaleseNew ZealanderNicaraguanNigerianNorthern EuropeanNorwegianOkinawanOsageOttawaPaiutePakistaniPalestinianPanamanianParaguayanPeruvianPimaPolishPortuguesePotawatomiPuebloPuerto RicanPuget Sound SalishRomanianRussianSalvadoranSamoanScandinavianScotch-IrishScottishSeminoleSenegaleseSerbianShoshoneSierra LeoneanSiouxSlavicSlovakSloveneSomaliSouth AfricanSouth AmericanSouth American IndianSoviet UnionSpaniardSpanishSpanish AmericanSpanish American IndianSri LankanSubsaharan AfricanSudaneseSwedishSwissSyrianTaiwaneseThaiTlingit-HaidaTohono O'OdhamTonganTrinidadian and TobagonianTsimshianTurkishU.S. Virgin IslanderUgandanUkrainianUruguayanUteVenezuelanVietnameseWelshWest IndianYakamaYaquiYugoslavianYumanYup'ikZimbabwean
Immigration
NonimmigrantsImmigrantsAfghanistanAfricaAlbaniaArgentinaArmeniaAsiaAustraliaAustriaBahamasBangladeshBarbadosBelarusBelgiumBelizeBoliviaBosnia and HerzegovinaBrazilBulgariaBurma/MyanmarCabo VerdeCambodiaCameroonCanadaCaribbeanCentral AmericaChileChinaColombiaCongoCosta RicaCroatiaCubaCzechoslovakiaDenmarkDominicaDominican RepublicEastern AfricaEastern AsiaEastern EuropeEcuadorEgyptEl SalvadorEnglandEritreaEthiopiaEuropeFijiFranceGermanyGhanaGreeceGrenadaGuatemalaGuyanaHaitiHondurasHong KongHungaryIndiaIndonesiaIranIraqIrelandIsraelItalyJamaicaJapanJordanKazakhstanKenyaKoreaKuwaitLaosLatin AmericaLatviaLebanonLiberiaLithuaniaMalaysiaMexicoMicronesiaMiddle AfricaMoldovaMoroccoNepalNetherlandsNicaraguaNigeriaNorth AmericaNorth MacedoniaNorthern AfricaNorthern EuropeNorwayOceaniaPakistanPanamaPeruPhilippinesPolandPortugalRomaniaRussiaSaudi ArabiaScotlandSenegalSerbiaSierra LeoneSingaporeSomaliaSouth AfricaSouth AmericaSouth Central AsiaSouth Eastern AsiaSouthern EuropeSpainSri LankaSt. Vincent and the GrenadinesSudanSwedenSwitzerlandSyriaTaiwanThailandTrinidad and TobagoTurkeyUgandaUkraineUruguayUzbekistanVenezuelaVietnamWest IndiesWestern AfricaWestern AsiaWestern EuropeYemenZaireZimbabweAzores
11th Grade
Income
Poverty
Unemployment
Labor Participation
Family Structure
Vehicle Availability
Education Level
Disability

11th Grade Comparison

Pennsylvania Germans

Argentineans

Tragic
Good
90.3%
11TH GRADE
0.0/ 100
METRIC RATING
288th/ 347
METRIC RANK
92.7%
11TH GRADE
73.4/ 100
METRIC RATING
155th/ 347
METRIC RANK

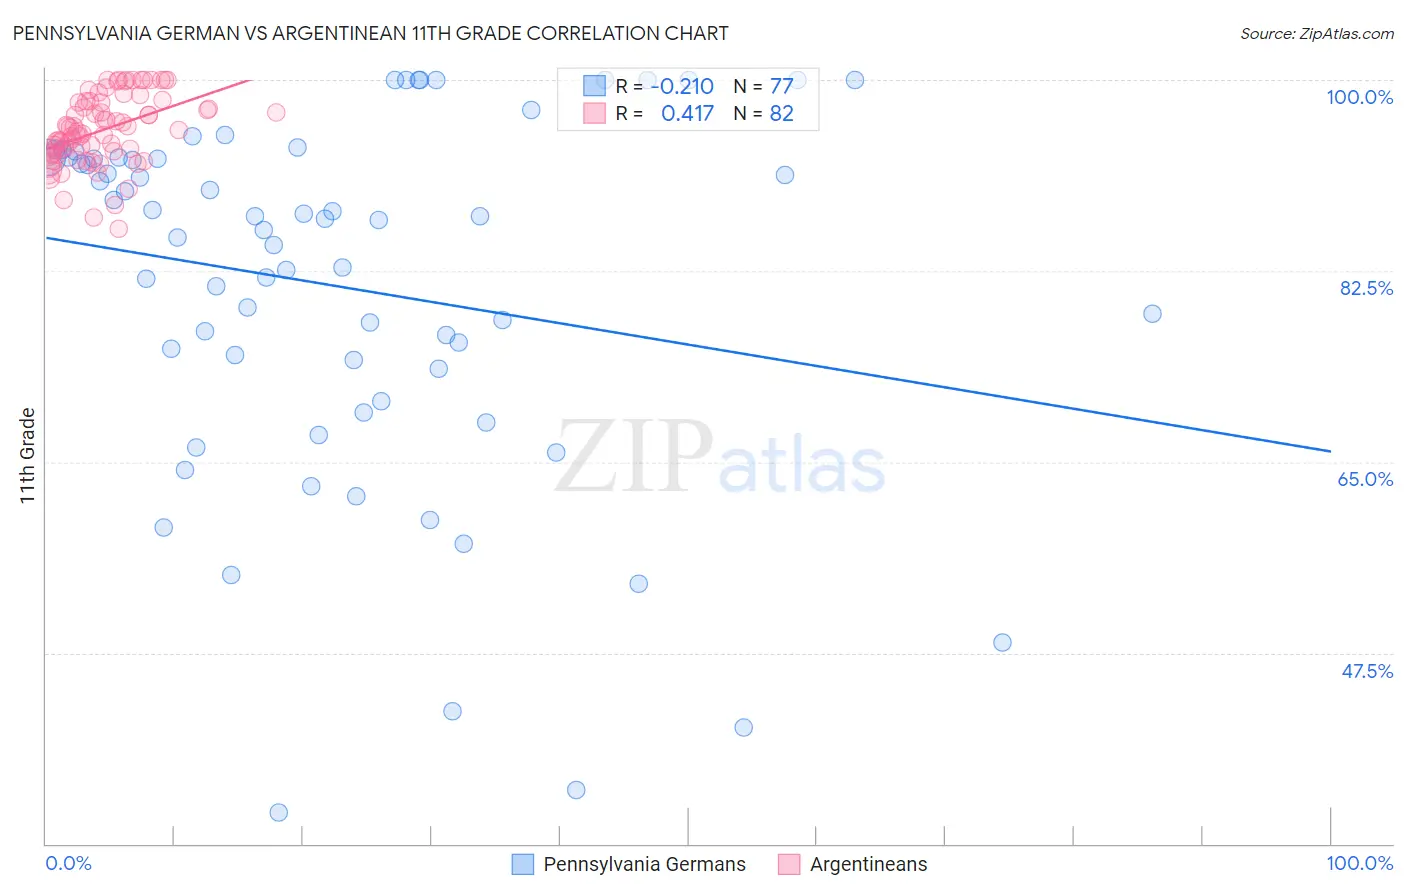
Pennsylvania German vs Argentinean 11th Grade Correlation Chart

The statistical analysis conducted on geographies consisting of 234,103,013 people shows a weak negative correlation between the proportion of Pennsylvania Germans and percentage of population with at least 11th grade education in the United States with a correlation coefficient (R) of -0.210 and weighted average of 90.3%. Similarly, the statistical analysis conducted on geographies consisting of 297,143,432 people shows a moderate positive correlation between the proportion of Argentineans and percentage of population with at least 11th grade education in the United States with a correlation coefficient (R) of 0.417 and weighted average of 92.7%, a difference of 2.7%.
Pennsylvania German vs Argentinean 11th Grade

11th Grade Correlation Summary

MeasurementPennsylvania GermanArgentinean
Minimum32.9%86.3%
Maximum100.0%100.0%
Range67.1%13.7%
Mean81.0%95.4%
Median87.1%95.3%
Interquartile 25% (IQ1)72.1%93.3%
Interquartile 75% (IQ3)92.9%97.9%
Interquartile Range (IQR)20.8%4.6%
Standard Deviation (Sample)16.6%3.2%
Standard Deviation (Population)16.4%3.2%

Similar Demographics by 11th Grade

Demographics Similar to Pennsylvania Germans by 11th Grade

In terms of 11th grade, the demographic groups most similar to Pennsylvania Germans are Apache (90.4%, a difference of 0.020%), British West Indian (90.3%, a difference of 0.020%), Immigrants from West Indies (90.4%, a difference of 0.030%), Indonesian (90.3%, a difference of 0.050%), and Immigrants from Burma/Myanmar (90.4%, a difference of 0.080%).
DemographicsRating | Rank11th Grade
Dutch West Indians
0.0
/100
|
#281
Tragic
90.7%
Immigrants | St. Vincent and the Grenadines
0.0
/100
|
#282
Tragic
90.7%
Immigrants | Barbados
0.0
/100
|
#283
Tragic
90.7%
Immigrants | Laos
0.0
/100
|
#284
Tragic
90.5%
Immigrants | Burma/Myanmar
0.0
/100
|
#285
Tragic
90.4%
Immigrants | West Indies
0.0
/100
|
#286
Tragic
90.4%
Apache
0.0
/100
|
#287
Tragic
90.4%
Pennsylvania Germans
0.0
/100
|
#288
Tragic
90.3%
British West Indians
0.0
/100
|
#289
Tragic
90.3%
Indonesians
0.0
/100
|
#290
Tragic
90.3%
Haitians
0.0
/100
|
#291
Tragic
90.3%
Cubans
0.0
/100
|
#292
Tragic
90.2%
Natives/Alaskans
0.0
/100
|
#293
Tragic
90.2%
Immigrants | Grenada
0.0
/100
|
#294
Tragic
90.1%
Immigrants | Vietnam
0.0
/100
|
#295
Tragic
90.0%

Demographics Similar to Argentineans by 11th Grade

In terms of 11th grade, the demographic groups most similar to Argentineans are Osage (92.7%, a difference of 0.0%), Immigrants from Spain (92.7%, a difference of 0.0%), Potawatomi (92.8%, a difference of 0.010%), Iraqi (92.8%, a difference of 0.010%), and Brazilian (92.8%, a difference of 0.010%).
DemographicsRating | Rank11th Grade
Hmong
78.6
/100
|
#148
Good
92.8%
Immigrants | Poland
78.5
/100
|
#149
Good
92.8%
Immigrants | Egypt
77.5
/100
|
#150
Good
92.8%
Potawatomi
74.3
/100
|
#151
Good
92.8%
Iraqis
74.2
/100
|
#152
Good
92.8%
Brazilians
73.9
/100
|
#153
Good
92.8%
Osage
73.4
/100
|
#154
Good
92.7%
Argentineans
73.4
/100
|
#155
Good
92.7%
Immigrants | Spain
73.0
/100
|
#156
Good
92.7%
Immigrants | Eastern Asia
72.6
/100
|
#157
Good
92.7%
Immigrants | Venezuela
72.0
/100
|
#158
Good
92.7%
Americans
71.7
/100
|
#159
Good
92.7%
Immigrants | Lebanon
70.7
/100
|
#160
Good
92.7%
Immigrants | Argentina
69.8
/100
|
#161
Good
92.7%
Paraguayans
68.7
/100
|
#162
Good
92.7%