Paraguayan vs Iroquois Bachelor's Degree

COMPARE

Paraguayan
Race
Ancestry
AfghanAfricanAlaska NativeAlaskan AthabascanAlbanianAleutAlsatianAmericanApacheArabArapahoArgentineanArmenianAssyrian/Chaldean/SyriacAustralianAustrianBahamianBangladeshiBarbadianBasqueBelgianBelizeanBermudanBhutaneseBlackfeetBolivianBrazilianBritishBritish West IndianBulgarianBurmeseCajunCambodianCanadianCape VerdeanCarpatho RusynCelticCentral AmericanCentral American IndianCherokeeCheyenneChickasawChileanChineseChippewaChoctawColombianColvilleComancheCosta RicanCreeCreekCroatianCrowCubanCypriotCzechCzechoslovakianDanishDelawareDominicanDutchDutch West IndianEastern EuropeanEcuadorianEgyptianEnglishEstonianEthiopianEuropeanFijianFilipinoFinnishFrenchFrench American IndianFrench CanadianGermanGerman RussianGhanaianGreekGuamanian/ChamorroGuatemalanGuyaneseHaitianHmongHonduranHopiHoumaHungarianIcelanderIndian (Asian)IndonesianInupiatIranianIraqiIrishIsraeliItalianJamaicanJapaneseJordanianKenyanKiowaKoreanLaotianLatvianLebaneseLiberianLithuanianLumbeeLuxembourgerMacedonianMalaysianMalteseMarshalleseMenomineeMexicanMexican American IndianMongolianMoroccanNative HawaiianNavajoNepaleseNew ZealanderNicaraguanNigerianNorthern EuropeanNorwegianOkinawanOsageOttawaPaiutePakistaniPalestinianPanamanianParaguayanPennsylvania GermanPeruvianPimaPolishPortuguesePotawatomiPuebloPuerto RicanPuget Sound SalishRomanianRussianSalvadoranSamoanScandinavianScotch-IrishScottishSeminoleSenegaleseSerbianShoshoneSierra LeoneanSiouxSlavicSlovakSloveneSomaliSouth AfricanSouth AmericanSouth American IndianSoviet UnionSpaniardSpanishSpanish AmericanSpanish American IndianSri LankanSubsaharan AfricanSudaneseSwedishSwissSyrianTaiwaneseThaiTlingit-HaidaTohono O'OdhamTonganTrinidadian and TobagonianTsimshianTurkishU.S. Virgin IslanderUgandanUkrainianUruguayanUteVenezuelanVietnameseWelshWest IndianYakamaYaquiYugoslavianYumanYup'ikZimbabwean
Immigration
NonimmigrantsImmigrantsAfghanistanAfricaAlbaniaArgentinaArmeniaAsiaAustraliaAustriaBahamasBangladeshBarbadosBelarusBelgiumBelizeBoliviaBosnia and HerzegovinaBrazilBulgariaBurma/MyanmarCabo VerdeCambodiaCameroonCanadaCaribbeanCentral AmericaChileChinaColombiaCongoCosta RicaCroatiaCubaCzechoslovakiaDenmarkDominicaDominican RepublicEastern AfricaEastern AsiaEastern EuropeEcuadorEgyptEl SalvadorEnglandEritreaEthiopiaEuropeFijiFranceGermanyGhanaGreeceGrenadaGuatemalaGuyanaHaitiHondurasHong KongHungaryIndiaIndonesiaIranIraqIrelandIsraelItalyJamaicaJapanJordanKazakhstanKenyaKoreaKuwaitLaosLatin AmericaLatviaLebanonLiberiaLithuaniaMalaysiaMexicoMicronesiaMiddle AfricaMoldovaMoroccoNepalNetherlandsNicaraguaNigeriaNorth AmericaNorth MacedoniaNorthern AfricaNorthern EuropeNorwayOceaniaPakistanPanamaPeruPhilippinesPolandPortugalRomaniaRussiaSaudi ArabiaScotlandSenegalSerbiaSierra LeoneSingaporeSomaliaSouth AfricaSouth AmericaSouth Central AsiaSouth Eastern AsiaSouthern EuropeSpainSri LankaSt. Vincent and the GrenadinesSudanSwedenSwitzerlandSyriaTaiwanThailandTrinidad and TobagoTurkeyUgandaUkraineUruguayUzbekistanVenezuelaVietnamWest IndiesWestern AfricaWestern AsiaWestern EuropeYemenZaireZimbabweAzores
Iroquois
Race
Ancestry
AfghanAfricanAlaska NativeAlaskan AthabascanAlbanianAleutAlsatianAmericanApacheArabArapahoArgentineanArmenianAssyrian/Chaldean/SyriacAustralianAustrianBahamianBangladeshiBarbadianBasqueBelgianBelizeanBermudanBhutaneseBlackfeetBolivianBrazilianBritishBritish West IndianBulgarianBurmeseCajunCambodianCanadianCape VerdeanCarpatho RusynCelticCentral AmericanCentral American IndianCherokeeCheyenneChickasawChileanChineseChippewaChoctawColombianColvilleComancheCosta RicanCreeCreekCroatianCrowCubanCypriotCzechCzechoslovakianDanishDelawareDominicanDutchDutch West IndianEastern EuropeanEcuadorianEgyptianEnglishEstonianEthiopianEuropeanFijianFilipinoFinnishFrenchFrench American IndianFrench CanadianGermanGerman RussianGhanaianGreekGuamanian/ChamorroGuatemalanGuyaneseHaitianHmongHonduranHopiHoumaHungarianIcelanderIndian (Asian)IndonesianInupiatIranianIraqiIrishIroquoisIsraeliItalianJamaicanJapaneseJordanianKenyanKiowaKoreanLaotianLatvianLebaneseLiberianLithuanianLumbeeLuxembourgerMacedonianMalaysianMalteseMarshalleseMenomineeMexicanMexican American IndianMongolianMoroccanNative HawaiianNavajoNepaleseNew ZealanderNicaraguanNigerianNorthern EuropeanNorwegianOkinawanOsageOttawaPaiutePakistaniPalestinianPanamanianPennsylvania GermanPeruvianPimaPolishPortuguesePotawatomiPuebloPuerto RicanPuget Sound SalishRomanianRussianSalvadoranSamoanScandinavianScotch-IrishScottishSeminoleSenegaleseSerbianShoshoneSierra LeoneanSiouxSlavicSlovakSloveneSomaliSouth AfricanSouth AmericanSouth American IndianSoviet UnionSpaniardSpanishSpanish AmericanSpanish American IndianSri LankanSubsaharan AfricanSudaneseSwedishSwissSyrianTaiwaneseThaiTlingit-HaidaTohono O'OdhamTonganTrinidadian and TobagonianTsimshianTurkishU.S. Virgin IslanderUgandanUkrainianUruguayanUteVenezuelanVietnameseWelshWest IndianYakamaYaquiYugoslavianYumanYup'ikZimbabwean
Immigration
NonimmigrantsImmigrantsAfghanistanAfricaAlbaniaArgentinaArmeniaAsiaAustraliaAustriaBahamasBangladeshBarbadosBelarusBelgiumBelizeBoliviaBosnia and HerzegovinaBrazilBulgariaBurma/MyanmarCabo VerdeCambodiaCameroonCanadaCaribbeanCentral AmericaChileChinaColombiaCongoCosta RicaCroatiaCubaCzechoslovakiaDenmarkDominicaDominican RepublicEastern AfricaEastern AsiaEastern EuropeEcuadorEgyptEl SalvadorEnglandEritreaEthiopiaEuropeFijiFranceGermanyGhanaGreeceGrenadaGuatemalaGuyanaHaitiHondurasHong KongHungaryIndiaIndonesiaIranIraqIrelandIsraelItalyJamaicaJapanJordanKazakhstanKenyaKoreaKuwaitLaosLatin AmericaLatviaLebanonLiberiaLithuaniaMalaysiaMexicoMicronesiaMiddle AfricaMoldovaMoroccoNepalNetherlandsNicaraguaNigeriaNorth AmericaNorth MacedoniaNorthern AfricaNorthern EuropeNorwayOceaniaPakistanPanamaPeruPhilippinesPolandPortugalRomaniaRussiaSaudi ArabiaScotlandSenegalSerbiaSierra LeoneSingaporeSomaliaSouth AfricaSouth AmericaSouth Central AsiaSouth Eastern AsiaSouthern EuropeSpainSri LankaSt. Vincent and the GrenadinesSudanSwedenSwitzerlandSyriaTaiwanThailandTrinidad and TobagoTurkeyUgandaUkraineUruguayUzbekistanVenezuelaVietnamWest IndiesWestern AfricaWestern AsiaWestern EuropeYemenZaireZimbabweAzores
Bachelor's Degree
Income
Poverty
Unemployment
Labor Participation
Family Structure
Vehicle Availability
Education Level
Disability

Bachelor's Degree Comparison

Paraguayans

Iroquois

Exceptional
Tragic
44.0%
BACHELOR'S DEGREE
99.9/ 100
METRIC RATING
57th/ 347
METRIC RANK
33.2%
BACHELOR'S DEGREE
0.7/ 100
METRIC RATING
255th/ 347
METRIC RANK

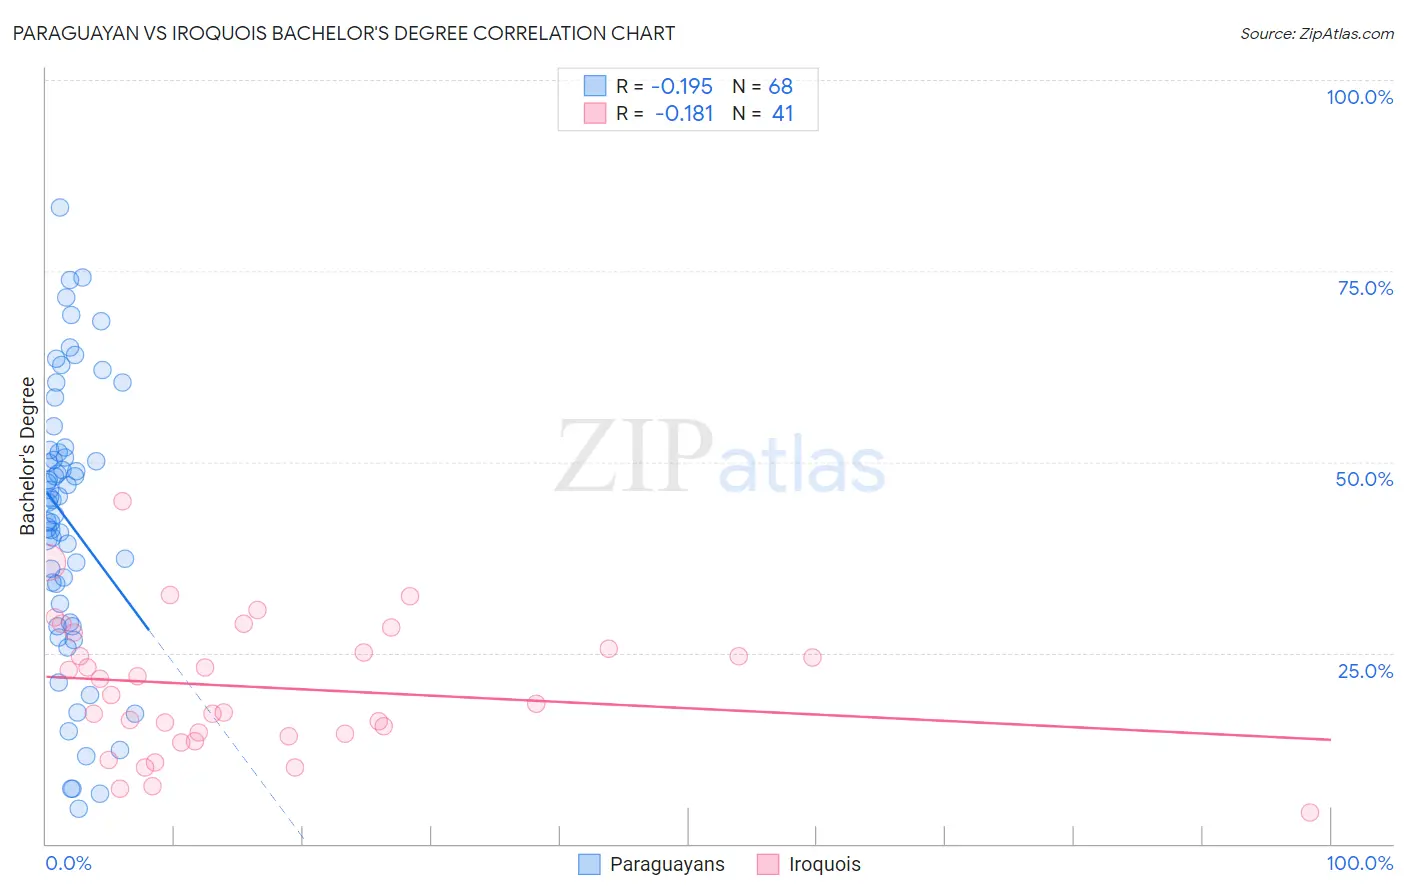
Paraguayan vs Iroquois Bachelor's Degree Correlation Chart

The statistical analysis conducted on geographies consisting of 95,113,072 people shows a poor negative correlation between the proportion of Paraguayans and percentage of population with at least bachelor's degree education in the United States with a correlation coefficient (R) of -0.195 and weighted average of 44.0%. Similarly, the statistical analysis conducted on geographies consisting of 207,306,427 people shows a poor negative correlation between the proportion of Iroquois and percentage of population with at least bachelor's degree education in the United States with a correlation coefficient (R) of -0.181 and weighted average of 33.2%, a difference of 32.6%.
Paraguayan vs Iroquois Bachelor's Degree

Bachelor's Degree Correlation Summary

MeasurementParaguayanIroquois
Minimum4.5%4.2%
Maximum83.2%44.8%
Range78.7%40.6%
Mean42.3%20.5%
Median44.9%19.5%
Interquartile 25% (IQ1)30.2%14.2%
Interquartile 75% (IQ3)51.4%26.5%
Interquartile Range (IQR)21.2%12.3%
Standard Deviation (Sample)18.1%8.7%
Standard Deviation (Population)17.9%8.6%

Similar Demographics by Bachelor's Degree

Demographics Similar to Paraguayans by Bachelor's Degree

In terms of bachelor's degree, the demographic groups most similar to Paraguayans are Immigrants from Czechoslovakia (44.0%, a difference of 0.050%), Australian (44.0%, a difference of 0.16%), New Zealander (44.0%, a difference of 0.16%), Immigrants from Serbia (44.1%, a difference of 0.19%), and Immigrants from Austria (44.2%, a difference of 0.37%).
DemographicsRating | RankBachelor's Degree
Immigrants | Greece
99.9
/100
|
#50
Exceptional
44.5%
Asians
99.9
/100
|
#51
Exceptional
44.4%
Immigrants | Spain
99.9
/100
|
#52
Exceptional
44.3%
Immigrants | Asia
99.9
/100
|
#53
Exceptional
44.3%
Immigrants | Austria
99.9
/100
|
#54
Exceptional
44.2%
Immigrants | Bolivia
99.9
/100
|
#55
Exceptional
44.2%
Immigrants | Serbia
99.9
/100
|
#56
Exceptional
44.1%
Paraguayans
99.9
/100
|
#57
Exceptional
44.0%
Immigrants | Czechoslovakia
99.9
/100
|
#58
Exceptional
44.0%
Australians
99.9
/100
|
#59
Exceptional
44.0%
New Zealanders
99.9
/100
|
#60
Exceptional
44.0%
South Africans
99.8
/100
|
#61
Exceptional
43.6%
Immigrants | Kazakhstan
99.8
/100
|
#62
Exceptional
43.4%
Immigrants | Europe
99.8
/100
|
#63
Exceptional
43.4%
Argentineans
99.7
/100
|
#64
Exceptional
43.3%

Demographics Similar to Iroquois by Bachelor's Degree

In terms of bachelor's degree, the demographic groups most similar to Iroquois are Native Hawaiian (33.2%, a difference of 0.020%), U.S. Virgin Islander (33.2%, a difference of 0.080%), Nicaraguan (33.1%, a difference of 0.19%), Immigrants from Bahamas (33.3%, a difference of 0.28%), and Japanese (33.3%, a difference of 0.36%).
DemographicsRating | RankBachelor's Degree
Cree
1.0
/100
|
#248
Tragic
33.6%
Immigrants | Liberia
0.9
/100
|
#249
Tragic
33.5%
Indonesians
0.9
/100
|
#250
Tragic
33.5%
Japanese
0.7
/100
|
#251
Tragic
33.3%
Immigrants | Bahamas
0.7
/100
|
#252
Tragic
33.3%
U.S. Virgin Islanders
0.7
/100
|
#253
Tragic
33.2%
Native Hawaiians
0.7
/100
|
#254
Tragic
33.2%
Iroquois
0.7
/100
|
#255
Tragic
33.2%
Nicaraguans
0.6
/100
|
#256
Tragic
33.1%
Spanish Americans
0.6
/100
|
#257
Tragic
33.1%
French American Indians
0.6
/100
|
#258
Tragic
33.1%
Osage
0.5
/100
|
#259
Tragic
33.0%
Malaysians
0.5
/100
|
#260
Tragic
32.9%
Africans
0.5
/100
|
#261
Tragic
32.9%
Immigrants | Jamaica
0.5
/100
|
#262
Tragic
32.9%