Panamanian vs South American Master's Degree

COMPARE

Panamanian
Race
Ancestry
AfghanAfricanAlaska NativeAlaskan AthabascanAlbanianAleutAlsatianAmericanApacheArabArapahoArgentineanArmenianAssyrian/Chaldean/SyriacAustralianAustrianBahamianBangladeshiBarbadianBasqueBelgianBelizeanBermudanBhutaneseBlackfeetBolivianBrazilianBritishBritish West IndianBulgarianBurmeseCajunCambodianCanadianCape VerdeanCarpatho RusynCelticCentral AmericanCentral American IndianCherokeeCheyenneChickasawChileanChineseChippewaChoctawColombianColvilleComancheCosta RicanCreeCreekCroatianCrowCubanCypriotCzechCzechoslovakianDanishDelawareDominicanDutchDutch West IndianEastern EuropeanEcuadorianEgyptianEnglishEstonianEthiopianEuropeanFijianFilipinoFinnishFrenchFrench American IndianFrench CanadianGermanGerman RussianGhanaianGreekGuamanian/ChamorroGuatemalanGuyaneseHaitianHmongHonduranHopiHoumaHungarianIcelanderIndian (Asian)IndonesianInupiatIranianIraqiIrishIroquoisIsraeliItalianJamaicanJapaneseJordanianKenyanKiowaKoreanLaotianLatvianLebaneseLiberianLithuanianLumbeeLuxembourgerMacedonianMalaysianMalteseMarshalleseMenomineeMexicanMexican American IndianMongolianMoroccanNative HawaiianNavajoNepaleseNew ZealanderNicaraguanNigerianNorthern EuropeanNorwegianOkinawanOsageOttawaPaiutePakistaniPalestinianPanamanianParaguayanPennsylvania GermanPeruvianPimaPolishPortuguesePotawatomiPuebloPuerto RicanPuget Sound SalishRomanianRussianSalvadoranSamoanScandinavianScotch-IrishScottishSeminoleSenegaleseSerbianShoshoneSierra LeoneanSiouxSlavicSlovakSloveneSomaliSouth AfricanSouth American IndianSoviet UnionSpaniardSpanishSpanish AmericanSpanish American IndianSri LankanSubsaharan AfricanSudaneseSwedishSwissSyrianTaiwaneseThaiTlingit-HaidaTohono O'OdhamTonganTrinidadian and TobagonianTsimshianTurkishU.S. Virgin IslanderUgandanUkrainianUruguayanUteVenezuelanVietnameseWelshWest IndianYakamaYaquiYugoslavianYumanYup'ikZimbabwean
Immigration
NonimmigrantsImmigrantsAfghanistanAfricaAlbaniaArgentinaArmeniaAsiaAustraliaAustriaBahamasBangladeshBarbadosBelarusBelgiumBelizeBoliviaBosnia and HerzegovinaBrazilBulgariaBurma/MyanmarCabo VerdeCambodiaCameroonCanadaCaribbeanCentral AmericaChileChinaColombiaCongoCosta RicaCroatiaCubaCzechoslovakiaDenmarkDominicaDominican RepublicEastern AfricaEastern AsiaEastern EuropeEcuadorEgyptEl SalvadorEnglandEritreaEthiopiaEuropeFijiFranceGermanyGhanaGreeceGrenadaGuatemalaGuyanaHaitiHondurasHong KongHungaryIndiaIndonesiaIranIraqIrelandIsraelItalyJamaicaJapanJordanKazakhstanKenyaKoreaKuwaitLaosLatin AmericaLatviaLebanonLiberiaLithuaniaMalaysiaMexicoMicronesiaMiddle AfricaMoldovaMoroccoNepalNetherlandsNicaraguaNigeriaNorth AmericaNorth MacedoniaNorthern AfricaNorthern EuropeNorwayOceaniaPakistanPanamaPeruPhilippinesPolandPortugalRomaniaRussiaSaudi ArabiaScotlandSenegalSerbiaSierra LeoneSingaporeSomaliaSouth AfricaSouth AmericaSouth Central AsiaSouth Eastern AsiaSouthern EuropeSpainSri LankaSt. Vincent and the GrenadinesSudanSwedenSwitzerlandSyriaTaiwanThailandTrinidad and TobagoTurkeyUgandaUkraineUruguayUzbekistanVenezuelaVietnamWest IndiesWestern AfricaWestern AsiaWestern EuropeYemenZaireZimbabweAzores
South American
Race
Ancestry
AfghanAfricanAlaska NativeAlaskan AthabascanAlbanianAleutAlsatianAmericanApacheArabArapahoArgentineanArmenianAssyrian/Chaldean/SyriacAustralianAustrianBahamianBangladeshiBarbadianBasqueBelgianBelizeanBermudanBhutaneseBlackfeetBolivianBrazilianBritishBritish West IndianBulgarianBurmeseCajunCambodianCanadianCape VerdeanCarpatho RusynCelticCentral AmericanCentral American IndianCherokeeCheyenneChickasawChileanChineseChippewaChoctawColombianColvilleComancheCosta RicanCreeCreekCroatianCrowCubanCypriotCzechCzechoslovakianDanishDelawareDominicanDutchDutch West IndianEastern EuropeanEcuadorianEgyptianEnglishEstonianEthiopianEuropeanFijianFilipinoFinnishFrenchFrench American IndianFrench CanadianGermanGerman RussianGhanaianGreekGuamanian/ChamorroGuatemalanGuyaneseHaitianHmongHonduranHopiHoumaHungarianIcelanderIndian (Asian)IndonesianInupiatIranianIraqiIrishIroquoisIsraeliItalianJamaicanJapaneseJordanianKenyanKiowaKoreanLaotianLatvianLebaneseLiberianLithuanianLumbeeLuxembourgerMacedonianMalaysianMalteseMarshalleseMenomineeMexicanMexican American IndianMongolianMoroccanNative HawaiianNavajoNepaleseNew ZealanderNicaraguanNigerianNorthern EuropeanNorwegianOkinawanOsageOttawaPaiutePakistaniPalestinianParaguayanPennsylvania GermanPeruvianPimaPolishPortuguesePotawatomiPuebloPuerto RicanPuget Sound SalishRomanianRussianSalvadoranSamoanScandinavianScotch-IrishScottishSeminoleSenegaleseSerbianShoshoneSierra LeoneanSiouxSlavicSlovakSloveneSomaliSouth AfricanSouth AmericanSouth American IndianSoviet UnionSpaniardSpanishSpanish AmericanSpanish American IndianSri LankanSubsaharan AfricanSudaneseSwedishSwissSyrianTaiwaneseThaiTlingit-HaidaTohono O'OdhamTonganTrinidadian and TobagonianTsimshianTurkishU.S. Virgin IslanderUgandanUkrainianUruguayanUteVenezuelanVietnameseWelshWest IndianYakamaYaquiYugoslavianYumanYup'ikZimbabwean
Immigration
NonimmigrantsImmigrantsAfghanistanAfricaAlbaniaArgentinaArmeniaAsiaAustraliaAustriaBahamasBangladeshBarbadosBelarusBelgiumBelizeBoliviaBosnia and HerzegovinaBrazilBulgariaBurma/MyanmarCabo VerdeCambodiaCameroonCanadaCaribbeanCentral AmericaChileChinaColombiaCongoCosta RicaCroatiaCubaCzechoslovakiaDenmarkDominicaDominican RepublicEastern AfricaEastern AsiaEastern EuropeEcuadorEgyptEl SalvadorEnglandEritreaEthiopiaEuropeFijiFranceGermanyGhanaGreeceGrenadaGuatemalaGuyanaHaitiHondurasHong KongHungaryIndiaIndonesiaIranIraqIrelandIsraelItalyJamaicaJapanJordanKazakhstanKenyaKoreaKuwaitLaosLatin AmericaLatviaLebanonLiberiaLithuaniaMalaysiaMexicoMicronesiaMiddle AfricaMoldovaMoroccoNepalNetherlandsNicaraguaNigeriaNorth AmericaNorth MacedoniaNorthern AfricaNorthern EuropeNorwayOceaniaPakistanPanamaPeruPhilippinesPolandPortugalRomaniaRussiaSaudi ArabiaScotlandSenegalSerbiaSierra LeoneSingaporeSomaliaSouth AfricaSouth AmericaSouth Central AsiaSouth Eastern AsiaSouthern EuropeSpainSri LankaSt. Vincent and the GrenadinesSudanSwedenSwitzerlandSyriaTaiwanThailandTrinidad and TobagoTurkeyUgandaUkraineUruguayUzbekistanVenezuelaVietnamWest IndiesWestern AfricaWestern AsiaWestern EuropeYemenZaireZimbabweAzores
Master's Degree
Income
Poverty
Unemployment
Labor Participation
Family Structure
Vehicle Availability
Education Level
Disability

Master's Degree Comparison

Panamanians

South Americans

Fair
Excellent
14.4%
MASTER'S DEGREE
25.1/ 100
METRIC RATING
200th/ 347
METRIC RANK
15.6%
MASTER'S DEGREE
81.3/ 100
METRIC RATING
145th/ 347
METRIC RANK

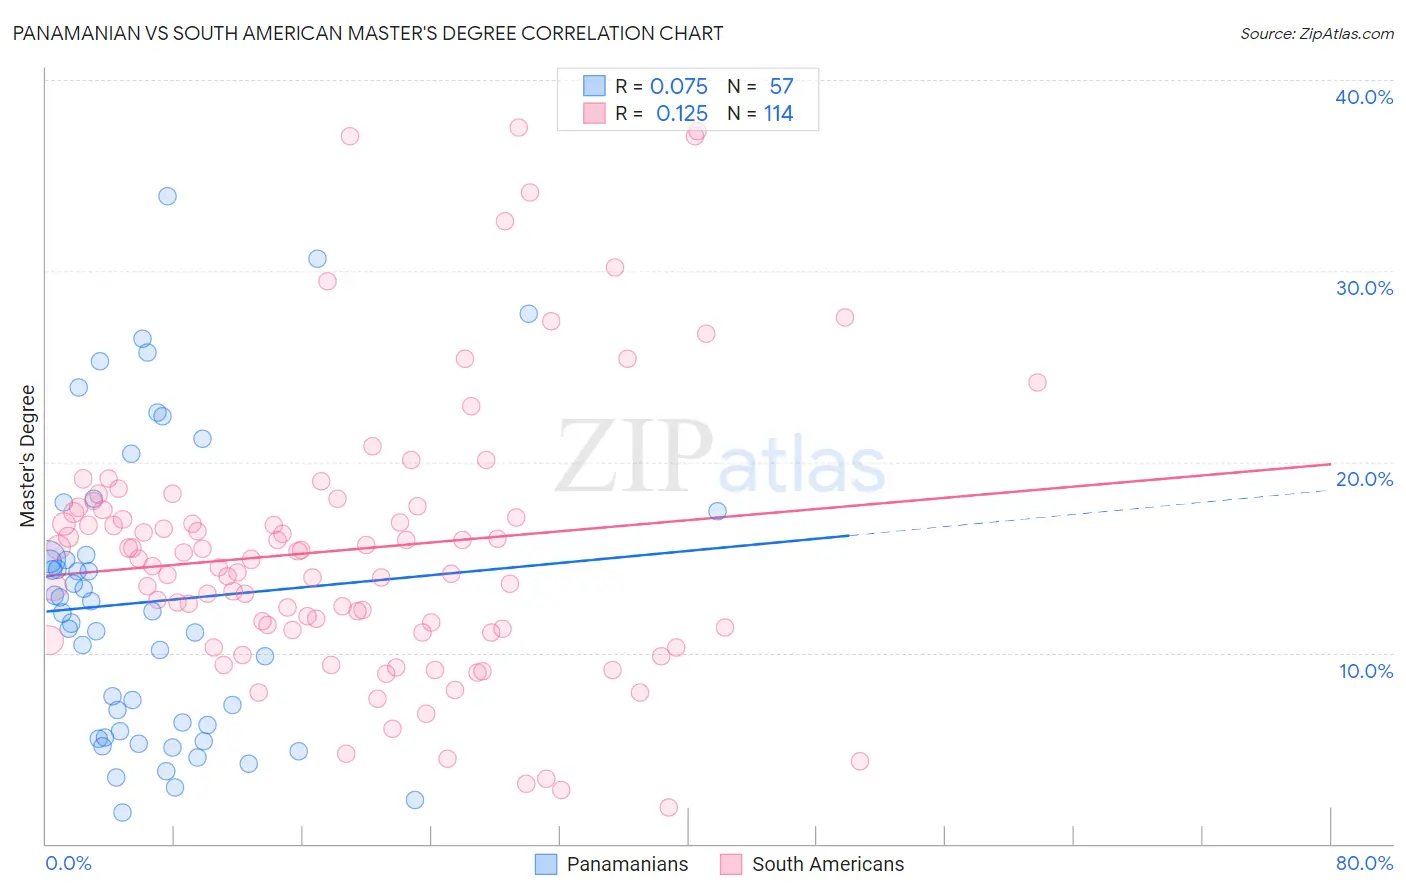
Panamanian vs South American Master's Degree Correlation Chart

The statistical analysis conducted on geographies consisting of 281,151,832 people shows a slight positive correlation between the proportion of Panamanians and percentage of population with at least master's degree education in the United States with a correlation coefficient (R) of 0.075 and weighted average of 14.4%. Similarly, the statistical analysis conducted on geographies consisting of 493,882,123 people shows a poor positive correlation between the proportion of South Americans and percentage of population with at least master's degree education in the United States with a correlation coefficient (R) of 0.125 and weighted average of 15.6%, a difference of 8.5%.
Panamanian vs South American Master's Degree

Master's Degree Correlation Summary

MeasurementPanamanianSouth American
Minimum1.6%1.9%
Maximum33.9%37.5%
Range32.3%35.6%
Mean12.7%15.4%
Median12.1%14.7%
Interquartile 25% (IQ1)5.7%11.2%
Interquartile 75% (IQ3)16.3%17.5%
Interquartile Range (IQR)10.5%6.3%
Standard Deviation (Sample)7.8%7.3%
Standard Deviation (Population)7.7%7.3%

Similar Demographics by Master's Degree

Demographics Similar to Panamanians by Master's Degree

In terms of master's degree, the demographic groups most similar to Panamanians are Scotch-Irish (14.4%, a difference of 0.010%), Immigrants from Western Africa (14.4%, a difference of 0.020%), Yugoslavian (14.4%, a difference of 0.13%), French (14.4%, a difference of 0.25%), and Trinidadian and Tobagonian (14.4%, a difference of 0.28%).
DemographicsRating | RankMaster's Degree
Immigrants | Nigeria
32.7
/100
|
#193
Fair
14.6%
Chinese
32.5
/100
|
#194
Fair
14.6%
Danes
31.3
/100
|
#195
Fair
14.5%
Czechoslovakians
29.9
/100
|
#196
Fair
14.5%
Belgians
28.0
/100
|
#197
Fair
14.5%
West Indians
27.4
/100
|
#198
Fair
14.5%
Immigrants | Armenia
27.2
/100
|
#199
Fair
14.5%
Panamanians
25.1
/100
|
#200
Fair
14.4%
Scotch-Irish
25.0
/100
|
#201
Fair
14.4%
Immigrants | Western Africa
24.9
/100
|
#202
Fair
14.4%
Yugoslavians
24.3
/100
|
#203
Fair
14.4%
French
23.7
/100
|
#204
Fair
14.4%
Trinidadians and Tobagonians
23.5
/100
|
#205
Fair
14.4%
Scandinavians
23.3
/100
|
#206
Fair
14.4%
Immigrants | Bosnia and Herzegovina
22.0
/100
|
#207
Fair
14.3%

Demographics Similar to South Americans by Master's Degree

In terms of master's degree, the demographic groups most similar to South Americans are Immigrants from Afghanistan (15.6%, a difference of 0.37%), Hungarian (15.6%, a difference of 0.41%), Canadian (15.7%, a difference of 0.42%), Immigrants from Venezuela (15.7%, a difference of 0.50%), and Immigrants from Senegal (15.5%, a difference of 0.58%).
DemographicsRating | RankMaster's Degree
Pakistanis
86.1
/100
|
#138
Excellent
15.8%
Immigrants | Germany
85.9
/100
|
#139
Excellent
15.8%
Vietnamese
85.5
/100
|
#140
Excellent
15.8%
Poles
85.0
/100
|
#141
Excellent
15.7%
Immigrants | Africa
84.0
/100
|
#142
Excellent
15.7%
Immigrants | Venezuela
83.6
/100
|
#143
Excellent
15.7%
Canadians
83.3
/100
|
#144
Excellent
15.7%
South Americans
81.3
/100
|
#145
Excellent
15.6%
Immigrants | Afghanistan
79.4
/100
|
#146
Good
15.6%
Hungarians
79.1
/100
|
#147
Good
15.6%
Immigrants | Senegal
78.2
/100
|
#148
Good
15.5%
Ghanaians
78.2
/100
|
#149
Good
15.5%
Slovenes
78.0
/100
|
#150
Good
15.5%
Iraqis
77.3
/100
|
#151
Good
15.5%
Slavs
77.0
/100
|
#152
Good
15.5%