Palestinian vs Immigrants from Liberia 10th Grade

COMPARE

Palestinian
Race
Ancestry
AfghanAfricanAlaska NativeAlaskan AthabascanAlbanianAleutAlsatianAmericanApacheArabArapahoArgentineanArmenianAssyrian/Chaldean/SyriacAustralianAustrianBahamianBangladeshiBarbadianBasqueBelgianBelizeanBermudanBhutaneseBlackfeetBolivianBrazilianBritishBritish West IndianBulgarianBurmeseCajunCambodianCanadianCape VerdeanCarpatho RusynCelticCentral AmericanCentral American IndianCherokeeCheyenneChickasawChileanChineseChippewaChoctawColombianColvilleComancheCosta RicanCreeCreekCroatianCrowCubanCypriotCzechCzechoslovakianDanishDelawareDominicanDutchDutch West IndianEastern EuropeanEcuadorianEgyptianEnglishEstonianEthiopianEuropeanFijianFilipinoFinnishFrenchFrench American IndianFrench CanadianGermanGerman RussianGhanaianGreekGuamanian/ChamorroGuatemalanGuyaneseHaitianHmongHonduranHopiHoumaHungarianIcelanderIndian (Asian)IndonesianInupiatIranianIraqiIrishIroquoisIsraeliItalianJamaicanJapaneseJordanianKenyanKiowaKoreanLaotianLatvianLebaneseLiberianLithuanianLumbeeLuxembourgerMacedonianMalaysianMalteseMarshalleseMenomineeMexicanMexican American IndianMongolianMoroccanNative HawaiianNavajoNepaleseNew ZealanderNicaraguanNigerianNorthern EuropeanNorwegianOkinawanOsageOttawaPaiutePakistaniPalestinianPanamanianParaguayanPennsylvania GermanPeruvianPimaPolishPortuguesePotawatomiPuebloPuerto RicanPuget Sound SalishRomanianRussianSalvadoranSamoanScandinavianScotch-IrishScottishSeminoleSenegaleseSerbianShoshoneSierra LeoneanSiouxSlavicSlovakSloveneSomaliSouth AfricanSouth AmericanSouth American IndianSoviet UnionSpaniardSpanishSpanish AmericanSpanish American IndianSri LankanSubsaharan AfricanSudaneseSwedishSwissSyrianTaiwaneseThaiTlingit-HaidaTohono O'OdhamTonganTrinidadian and TobagonianTsimshianTurkishU.S. Virgin IslanderUgandanUkrainianUruguayanUteVenezuelanVietnameseWelshWest IndianYakamaYaquiYugoslavianYumanYup'ikZimbabwean
Immigration
NonimmigrantsImmigrantsAfghanistanAfricaAlbaniaArgentinaArmeniaAsiaAustraliaAustriaBahamasBangladeshBarbadosBelarusBelgiumBelizeBoliviaBosnia and HerzegovinaBrazilBulgariaBurma/MyanmarCabo VerdeCambodiaCameroonCanadaCaribbeanCentral AmericaChileChinaColombiaCongoCosta RicaCroatiaCubaCzechoslovakiaDenmarkDominicaDominican RepublicEastern AfricaEastern AsiaEastern EuropeEcuadorEgyptEl SalvadorEnglandEritreaEthiopiaEuropeFijiFranceGermanyGhanaGreeceGrenadaGuatemalaGuyanaHaitiHondurasHong KongHungaryIndiaIndonesiaIranIraqIrelandIsraelItalyJamaicaJapanJordanKazakhstanKenyaKoreaKuwaitLaosLatin AmericaLatviaLebanonLithuaniaMalaysiaMexicoMicronesiaMiddle AfricaMoldovaMoroccoNepalNetherlandsNicaraguaNigeriaNorth AmericaNorth MacedoniaNorthern AfricaNorthern EuropeNorwayOceaniaPakistanPanamaPeruPhilippinesPolandPortugalRomaniaRussiaSaudi ArabiaScotlandSenegalSerbiaSierra LeoneSingaporeSomaliaSouth AfricaSouth AmericaSouth Central AsiaSouth Eastern AsiaSouthern EuropeSpainSri LankaSt. Vincent and the GrenadinesSudanSwedenSwitzerlandSyriaTaiwanThailandTrinidad and TobagoTurkeyUgandaUkraineUruguayUzbekistanVenezuelaVietnamWest IndiesWestern AfricaWestern AsiaWestern EuropeYemenZaireZimbabweAzores
Immigrants from Liberia
Race
Ancestry
AfghanAfricanAlaska NativeAlaskan AthabascanAlbanianAleutAlsatianAmericanApacheArabArapahoArgentineanArmenianAssyrian/Chaldean/SyriacAustralianAustrianBahamianBangladeshiBarbadianBasqueBelgianBelizeanBermudanBhutaneseBlackfeetBolivianBrazilianBritishBritish West IndianBulgarianBurmeseCajunCambodianCanadianCape VerdeanCarpatho RusynCelticCentral AmericanCentral American IndianCherokeeCheyenneChickasawChileanChineseChippewaChoctawColombianColvilleComancheCosta RicanCreeCreekCroatianCrowCubanCypriotCzechCzechoslovakianDanishDelawareDominicanDutchDutch West IndianEastern EuropeanEcuadorianEgyptianEnglishEstonianEthiopianEuropeanFijianFilipinoFinnishFrenchFrench American IndianFrench CanadianGermanGerman RussianGhanaianGreekGuamanian/ChamorroGuatemalanGuyaneseHaitianHmongHonduranHopiHoumaHungarianIcelanderIndian (Asian)IndonesianInupiatIranianIraqiIrishIroquoisIsraeliItalianJamaicanJapaneseJordanianKenyanKiowaKoreanLaotianLatvianLebaneseLiberianLithuanianLumbeeLuxembourgerMacedonianMalaysianMalteseMarshalleseMenomineeMexicanMexican American IndianMongolianMoroccanNative HawaiianNavajoNepaleseNew ZealanderNicaraguanNigerianNorthern EuropeanNorwegianOkinawanOsageOttawaPaiutePakistaniPanamanianParaguayanPennsylvania GermanPeruvianPimaPolishPortuguesePotawatomiPuebloPuerto RicanPuget Sound SalishRomanianRussianSalvadoranSamoanScandinavianScotch-IrishScottishSeminoleSenegaleseSerbianShoshoneSierra LeoneanSiouxSlavicSlovakSloveneSomaliSouth AfricanSouth AmericanSouth American IndianSoviet UnionSpaniardSpanishSpanish AmericanSpanish American IndianSri LankanSubsaharan AfricanSudaneseSwedishSwissSyrianTaiwaneseThaiTlingit-HaidaTohono O'OdhamTonganTrinidadian and TobagonianTsimshianTurkishU.S. Virgin IslanderUgandanUkrainianUruguayanUteVenezuelanVietnameseWelshWest IndianYakamaYaquiYugoslavianYumanYup'ikZimbabwean
Immigration
NonimmigrantsImmigrantsAfghanistanAfricaAlbaniaArgentinaArmeniaAsiaAustraliaAustriaBahamasBangladeshBarbadosBelarusBelgiumBelizeBoliviaBosnia and HerzegovinaBrazilBulgariaBurma/MyanmarCabo VerdeCambodiaCameroonCanadaCaribbeanCentral AmericaChileChinaColombiaCongoCosta RicaCroatiaCubaCzechoslovakiaDenmarkDominicaDominican RepublicEastern AfricaEastern AsiaEastern EuropeEcuadorEgyptEl SalvadorEnglandEritreaEthiopiaEuropeFijiFranceGermanyGhanaGreeceGrenadaGuatemalaGuyanaHaitiHondurasHong KongHungaryIndiaIndonesiaIranIraqIrelandIsraelItalyJamaicaJapanJordanKazakhstanKenyaKoreaKuwaitLaosLatin AmericaLatviaLebanonLiberiaLithuaniaMalaysiaMexicoMicronesiaMiddle AfricaMoldovaMoroccoNepalNetherlandsNicaraguaNigeriaNorth AmericaNorth MacedoniaNorthern AfricaNorthern EuropeNorwayOceaniaPakistanPanamaPeruPhilippinesPolandPortugalRomaniaRussiaSaudi ArabiaScotlandSenegalSerbiaSierra LeoneSingaporeSomaliaSouth AfricaSouth AmericaSouth Central AsiaSouth Eastern AsiaSouthern EuropeSpainSri LankaSt. Vincent and the GrenadinesSudanSwedenSwitzerlandSyriaTaiwanThailandTrinidad and TobagoTurkeyUgandaUkraineUruguayUzbekistanVenezuelaVietnamWest IndiesWestern AfricaWestern AsiaWestern EuropeYemenZaireZimbabweAzores
10th Grade
Income
Poverty
Unemployment
Labor Participation
Family Structure
Vehicle Availability
Education Level
Disability

10th Grade Comparison

Palestinians

Immigrants from Liberia

Exceptional
Poor
94.4%
10TH GRADE
96.5/ 100
METRIC RATING
113th/ 347
METRIC RANK
93.3%
10TH GRADE
10.2/ 100
METRIC RATING
218th/ 347
METRIC RANK

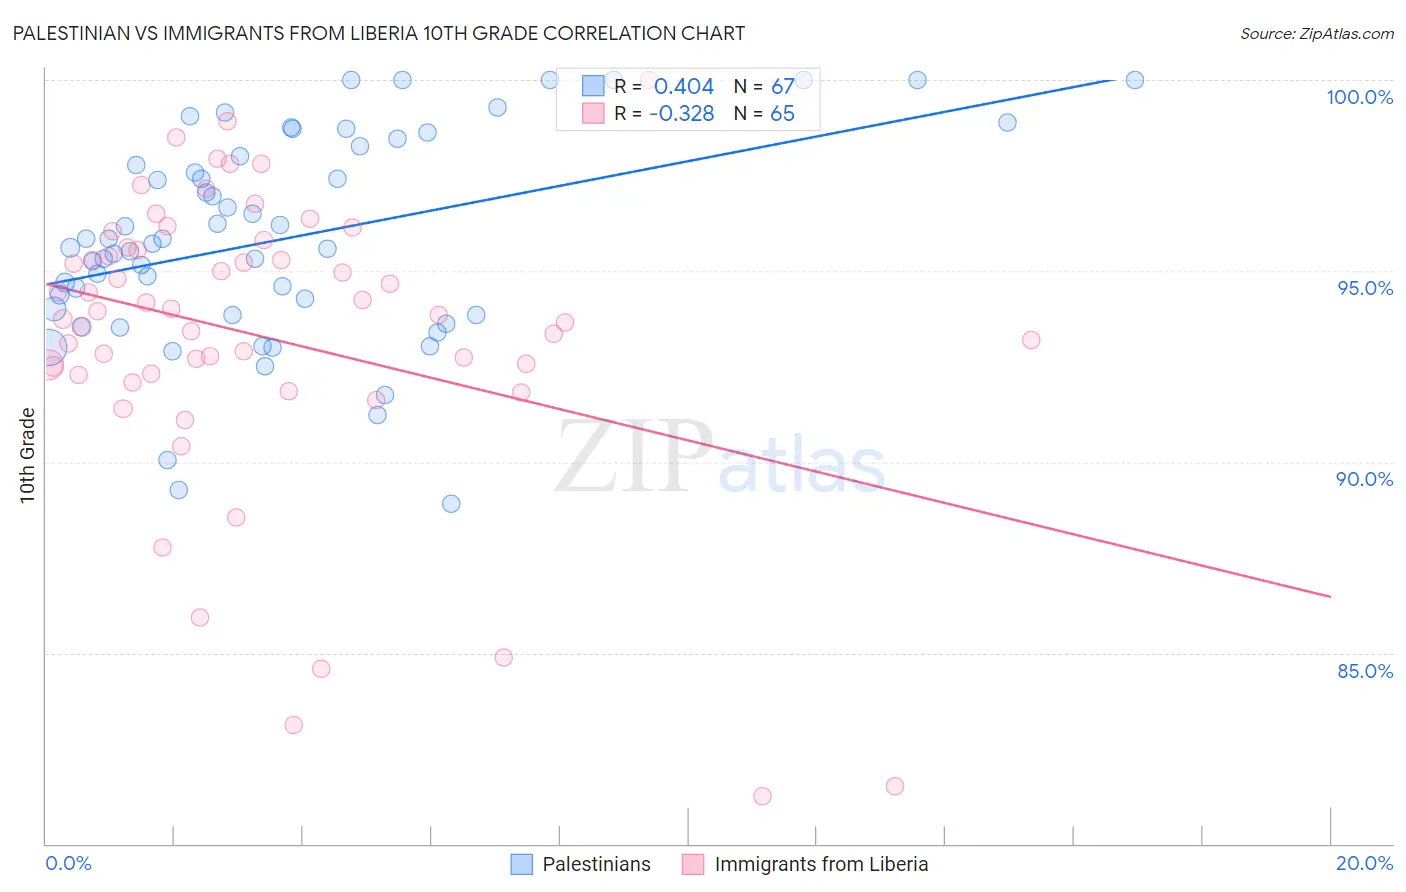
Palestinian vs Immigrants from Liberia 10th Grade Correlation Chart

The statistical analysis conducted on geographies consisting of 216,424,519 people shows a moderate positive correlation between the proportion of Palestinians and percentage of population with at least 10th grade education in the United States with a correlation coefficient (R) of 0.404 and weighted average of 94.4%. Similarly, the statistical analysis conducted on geographies consisting of 135,295,697 people shows a mild negative correlation between the proportion of Immigrants from Liberia and percentage of population with at least 10th grade education in the United States with a correlation coefficient (R) of -0.328 and weighted average of 93.3%, a difference of 1.2%.
Palestinian vs Immigrants from Liberia 10th Grade

10th Grade Correlation Summary

MeasurementPalestinianImmigrants from Liberia
Minimum88.9%81.2%
Maximum100.0%100.0%
Range11.1%18.8%
Mean95.9%93.3%
Median95.7%93.8%
Interquartile 25% (IQ1)93.8%92.3%
Interquartile 75% (IQ3)98.3%95.6%
Interquartile Range (IQR)4.4%3.3%
Standard Deviation (Sample)2.7%3.9%
Standard Deviation (Population)2.7%3.9%

Similar Demographics by 10th Grade

Demographics Similar to Palestinians by 10th Grade

In terms of 10th grade, the demographic groups most similar to Palestinians are Immigrants from Zimbabwe (94.4%, a difference of 0.020%), Immigrants from Kuwait (94.4%, a difference of 0.020%), German Russian (94.4%, a difference of 0.020%), Delaware (94.4%, a difference of 0.020%), and Sioux (94.4%, a difference of 0.020%).
DemographicsRating | Rank10th Grade
Immigrants | Serbia
97.4
/100
|
#106
Exceptional
94.5%
Immigrants | Croatia
97.4
/100
|
#107
Exceptional
94.5%
Immigrants | North Macedonia
97.2
/100
|
#108
Exceptional
94.5%
Immigrants | Norway
97.2
/100
|
#109
Exceptional
94.5%
Burmese
97.1
/100
|
#110
Exceptional
94.5%
Immigrants | Zimbabwe
96.8
/100
|
#111
Exceptional
94.4%
Immigrants | Kuwait
96.8
/100
|
#112
Exceptional
94.4%
Palestinians
96.5
/100
|
#113
Exceptional
94.4%
German Russians
96.3
/100
|
#114
Exceptional
94.4%
Delaware
96.3
/100
|
#115
Exceptional
94.4%
Sioux
96.2
/100
|
#116
Exceptional
94.4%
Immigrants | Hungary
95.8
/100
|
#117
Exceptional
94.4%
Jordanians
95.6
/100
|
#118
Exceptional
94.4%
Immigrants | Israel
95.4
/100
|
#119
Exceptional
94.4%
Immigrants | Taiwan
95.3
/100
|
#120
Exceptional
94.4%

Demographics Similar to Immigrants from Liberia by 10th Grade

In terms of 10th grade, the demographic groups most similar to Immigrants from Liberia are Seminole (93.3%, a difference of 0.0%), Tongan (93.3%, a difference of 0.020%), Portuguese (93.3%, a difference of 0.040%), Immigrants from Southern Europe (93.2%, a difference of 0.040%), and Ethiopian (93.2%, a difference of 0.070%).
DemographicsRating | Rank10th Grade
Cajuns
16.9
/100
|
#211
Poor
93.4%
Immigrants | Zaire
16.7
/100
|
#212
Poor
93.4%
Immigrants | Asia
15.7
/100
|
#213
Poor
93.4%
Immigrants | Bahamas
15.2
/100
|
#214
Poor
93.4%
Immigrants | Oceania
15.1
/100
|
#215
Poor
93.4%
Immigrants | Eastern Africa
14.7
/100
|
#216
Poor
93.4%
Portuguese
12.1
/100
|
#217
Poor
93.3%
Immigrants | Liberia
10.2
/100
|
#218
Poor
93.3%
Seminole
10.2
/100
|
#219
Poor
93.3%
Tongans
9.5
/100
|
#220
Tragic
93.3%
Immigrants | Southern Europe
8.9
/100
|
#221
Tragic
93.2%
Ethiopians
7.9
/100
|
#222
Tragic
93.2%
Immigrants | Sierra Leone
7.6
/100
|
#223
Tragic
93.2%
Bolivians
6.7
/100
|
#224
Tragic
93.2%
Somalis
6.2
/100
|
#225
Tragic
93.2%