Pakistani vs Immigrants from Oceania Professional Degree
COMPARE
Pakistani
Immigrants from Oceania
Professional Degree
Professional Degree Comparison
Pakistanis
Immigrants from Oceania
4.8%
PROFESSIONAL DEGREE
90.9/ 100
METRIC RATING
132nd/ 347
METRIC RANK
4.6%
PROFESSIONAL DEGREE
73.4/ 100
METRIC RATING
150th/ 347
METRIC RANK
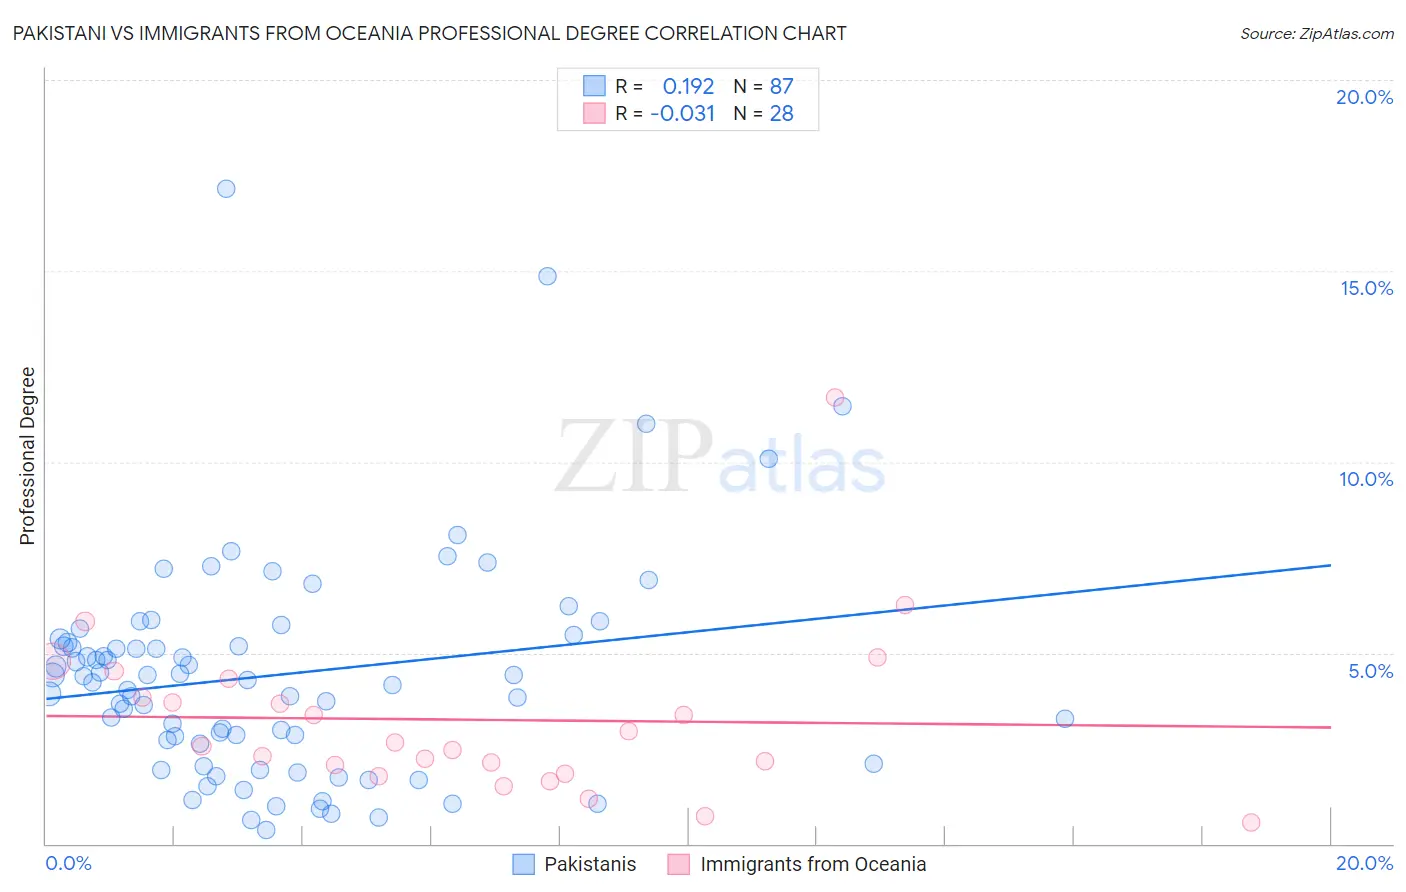
Pakistani vs Immigrants from Oceania Professional Degree Correlation Chart
The statistical analysis conducted on geographies consisting of 334,796,739 people shows a poor positive correlation between the proportion of Pakistanis and percentage of population with at least professional degree education in the United States with a correlation coefficient (R) of 0.192 and weighted average of 4.8%. Similarly, the statistical analysis conducted on geographies consisting of 305,056,134 people shows no correlation between the proportion of Immigrants from Oceania and percentage of population with at least professional degree education in the United States with a correlation coefficient (R) of -0.031 and weighted average of 4.6%, a difference of 4.5%.
Professional Degree Correlation Summary
| Measurement | Pakistani | Immigrants from Oceania |
| Minimum | 0.37% | 0.57% |
| Maximum | 17.1% | 11.7% |
| Range | 16.8% | 11.1% |
| Mean | 4.4% | 3.2% |
| Median | 4.3% | 2.6% |
| Interquartile 25% (IQ1) | 2.6% | 2.0% |
| Interquartile 75% (IQ3) | 5.4% | 4.1% |
| Interquartile Range (IQR) | 2.8% | 2.1% |
| Standard Deviation (Sample) | 2.9% | 2.2% |
| Standard Deviation (Population) | 2.9% | 2.2% |
Demographics Similar to Pakistanis and Immigrants from Oceania by Professional Degree
In terms of professional degree, the demographic groups most similar to Pakistanis are Immigrants from Nepal (4.8%, a difference of 0.22%), Italian (4.8%, a difference of 0.25%), South American Indian (4.8%, a difference of 0.38%), Macedonian (4.8%, a difference of 0.41%), and Immigrants from Jordan (4.7%, a difference of 0.69%). Similarly, the demographic groups most similar to Immigrants from Oceania are Polish (4.6%, a difference of 0.14%), Senegalese (4.6%, a difference of 0.35%), Slovene (4.6%, a difference of 0.50%), Colombian (4.6%, a difference of 0.82%), and Luxembourger (4.6%, a difference of 1.0%).
| Demographics | Rating | Rank | Professional Degree |
| Immigrants | Nepal | 91.4 /100 | #131 | Exceptional 4.8% |
| Pakistanis | 90.9 /100 | #132 | Exceptional 4.8% |
| Italians | 90.2 /100 | #133 | Exceptional 4.8% |
| South American Indians | 89.9 /100 | #134 | Excellent 4.8% |
| Macedonians | 89.8 /100 | #135 | Excellent 4.8% |
| Immigrants | Jordan | 89.0 /100 | #136 | Excellent 4.7% |
| Jordanians | 88.9 /100 | #137 | Excellent 4.7% |
| Afghans | 88.8 /100 | #138 | Excellent 4.7% |
| South Americans | 85.6 /100 | #139 | Excellent 4.7% |
| Canadians | 84.4 /100 | #140 | Excellent 4.7% |
| Basques | 81.8 /100 | #141 | Excellent 4.6% |
| Sudanese | 81.3 /100 | #142 | Excellent 4.6% |
| Hungarians | 80.8 /100 | #143 | Excellent 4.6% |
| Immigrants | South America | 80.5 /100 | #144 | Excellent 4.6% |
| Uruguayans | 80.2 /100 | #145 | Excellent 4.6% |
| Luxembourgers | 78.7 /100 | #146 | Good 4.6% |
| Colombians | 77.7 /100 | #147 | Good 4.6% |
| Slovenes | 76.1 /100 | #148 | Good 4.6% |
| Senegalese | 75.3 /100 | #149 | Good 4.6% |
| Immigrants | Oceania | 73.4 /100 | #150 | Good 4.6% |
| Poles | 72.6 /100 | #151 | Good 4.6% |