Pakistani vs Immigrants from England High School Diploma
COMPARE
Pakistani
Immigrants from England
High School Diploma
High School Diploma Comparison
Pakistanis
Immigrants from England
89.6%
HIGH SCHOOL DIPLOMA
78.3/ 100
METRIC RATING
143rd/ 347
METRIC RANK
90.8%
HIGH SCHOOL DIPLOMA
99.3/ 100
METRIC RATING
80th/ 347
METRIC RANK
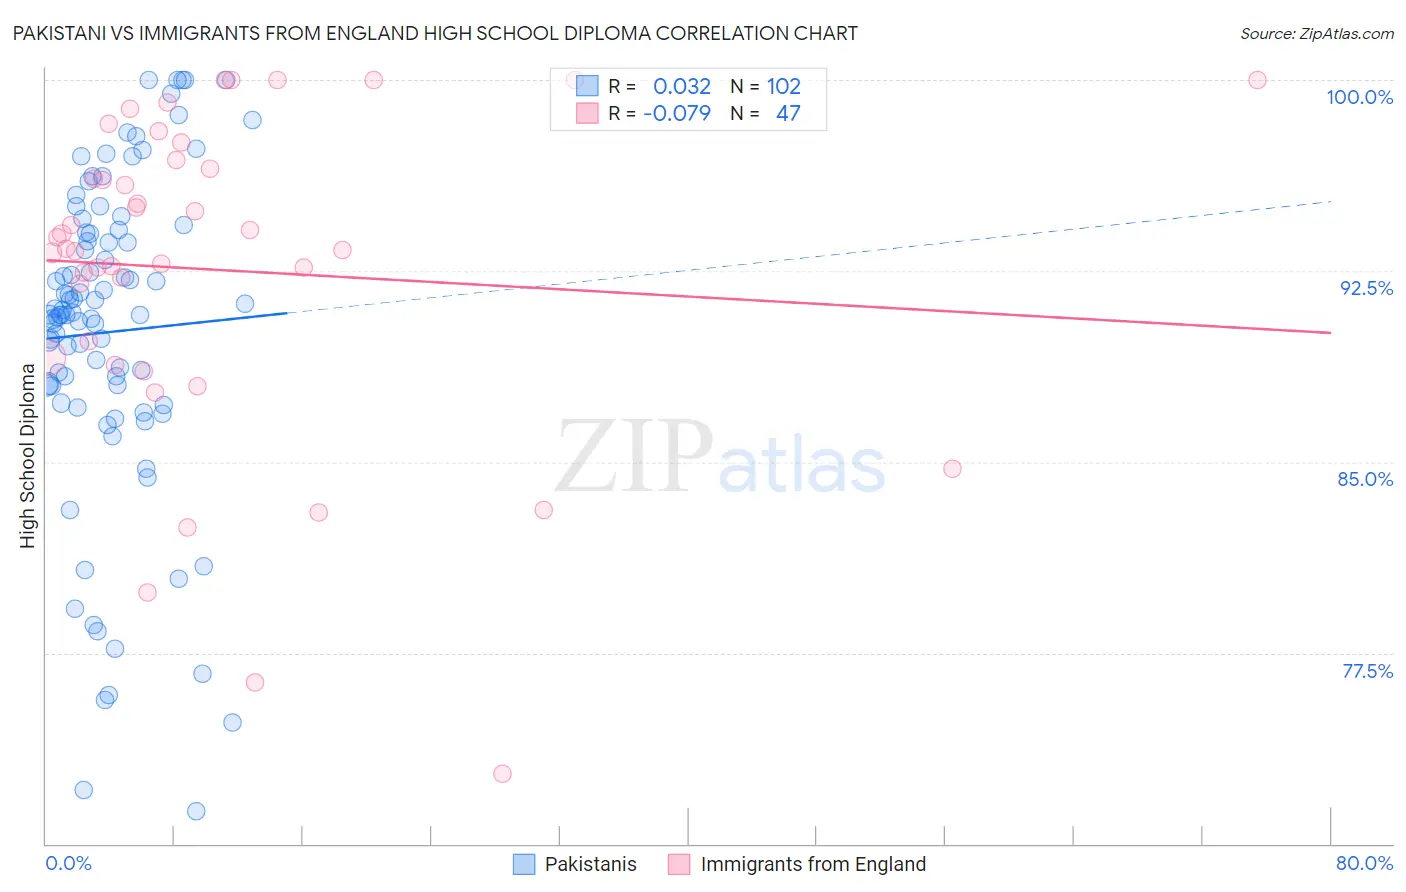
Pakistani vs Immigrants from England High School Diploma Correlation Chart
The statistical analysis conducted on geographies consisting of 335,356,437 people shows no correlation between the proportion of Pakistanis and percentage of population with at least high school diploma education in the United States with a correlation coefficient (R) of 0.032 and weighted average of 89.6%. Similarly, the statistical analysis conducted on geographies consisting of 391,897,700 people shows a slight negative correlation between the proportion of Immigrants from England and percentage of population with at least high school diploma education in the United States with a correlation coefficient (R) of -0.079 and weighted average of 90.8%, a difference of 1.4%.
High School Diploma Correlation Summary
| Measurement | Pakistani | Immigrants from England |
| Minimum | 71.3% | 72.7% |
| Maximum | 100.0% | 100.0% |
| Range | 28.7% | 27.3% |
| Mean | 90.1% | 92.5% |
| Median | 90.8% | 93.4% |
| Interquartile 25% (IQ1) | 88.0% | 89.1% |
| Interquartile 75% (IQ3) | 94.0% | 96.9% |
| Interquartile Range (IQR) | 6.0% | 7.8% |
| Standard Deviation (Sample) | 6.3% | 6.4% |
| Standard Deviation (Population) | 6.3% | 6.3% |
Similar Demographics by High School Diploma
Demographics Similar to Pakistanis by High School Diploma
In terms of high school diploma, the demographic groups most similar to Pakistanis are Indian (Asian) (89.6%, a difference of 0.010%), Immigrants from Kenya (89.6%, a difference of 0.010%), Chilean (89.6%, a difference of 0.020%), Immigrants from Brazil (89.5%, a difference of 0.040%), and Immigrants from Spain (89.5%, a difference of 0.050%).
| Demographics | Rating | Rank | High School Diploma |
| Ugandans | 83.7 /100 | #136 | Excellent 89.7% |
| Arabs | 83.6 /100 | #137 | Excellent 89.7% |
| Assyrians/Chaldeans/Syriacs | 82.5 /100 | #138 | Excellent 89.7% |
| Kenyans | 81.4 /100 | #139 | Excellent 89.6% |
| Immigrants | Egypt | 81.2 /100 | #140 | Excellent 89.6% |
| Chileans | 79.0 /100 | #141 | Good 89.6% |
| Indians (Asian) | 78.8 /100 | #142 | Good 89.6% |
| Pakistanis | 78.3 /100 | #143 | Good 89.6% |
| Immigrants | Kenya | 78.0 /100 | #144 | Good 89.6% |
| Immigrants | Brazil | 76.6 /100 | #145 | Good 89.5% |
| Immigrants | Spain | 76.2 /100 | #146 | Good 89.5% |
| Iraqis | 73.9 /100 | #147 | Good 89.5% |
| Immigrants | Lebanon | 73.4 /100 | #148 | Good 89.5% |
| Immigrants | Poland | 72.9 /100 | #149 | Good 89.5% |
| Argentineans | 72.3 /100 | #150 | Good 89.5% |
Demographics Similar to Immigrants from England by High School Diploma
In terms of high school diploma, the demographic groups most similar to Immigrants from England are Immigrants from Switzerland (90.8%, a difference of 0.0%), Immigrants from Denmark (90.8%, a difference of 0.010%), Native Hawaiian (90.8%, a difference of 0.020%), Burmese (90.8%, a difference of 0.020%), and Hungarian (90.8%, a difference of 0.030%).
| Demographics | Rating | Rank | High School Diploma |
| Immigrants | South Central Asia | 99.4 /100 | #73 | Exceptional 90.9% |
| Immigrants | Czechoslovakia | 99.4 /100 | #74 | Exceptional 90.9% |
| Cambodians | 99.4 /100 | #75 | Exceptional 90.8% |
| Hungarians | 99.3 /100 | #76 | Exceptional 90.8% |
| Native Hawaiians | 99.3 /100 | #77 | Exceptional 90.8% |
| Burmese | 99.3 /100 | #78 | Exceptional 90.8% |
| Immigrants | Denmark | 99.3 /100 | #79 | Exceptional 90.8% |
| Immigrants | England | 99.3 /100 | #80 | Exceptional 90.8% |
| Immigrants | Switzerland | 99.3 /100 | #81 | Exceptional 90.8% |
| Scotch-Irish | 99.2 /100 | #82 | Exceptional 90.8% |
| Immigrants | Moldova | 99.2 /100 | #83 | Exceptional 90.7% |
| Immigrants | Saudi Arabia | 99.1 /100 | #84 | Exceptional 90.7% |
| Romanians | 98.9 /100 | #85 | Exceptional 90.7% |
| Immigrants | Bulgaria | 98.9 /100 | #86 | Exceptional 90.6% |
| Immigrants | Turkey | 98.9 /100 | #87 | Exceptional 90.6% |